
# NUI - 普元新一代前端开发框架,快速开发WebUI
- 快速开发,减少50%代码量
- 丰富组件库,高性能、低内存
- 支持 IE6+、FireFox、Chrome
它能缩短开发时间,减少代码量,使开发者更专注于业务和服务端,轻松实现界面开发,带来绝佳的用户体验;它有丰富的UI控件、高度的稳定性、强大的扩展能力和平滑的版本升级能力,可满足大部分业务场景需求。
# 快速入门
# 安装使用
nui示例使用说明
nui是公司新一代的前端开发框架,它精致优雅的前端编程模型,可以让用户快速便捷的使用开发,nui示例则是开发者入门很好的助手。
将nui-demo4eos-src.zip或nui-eos-src.zip解压到war(如果是jee应用)的目录下,会有如下文件结构(nui-demo4eos.ecd部署后同样):
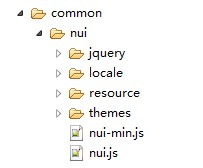
各目录文件解释如下:
- common/nui:NUI产品的javascript和css。
- common/nui/locale:语言资源文件。
- common/nui/themes:多套皮肤样式。
Note:开发者只需要引用nui.js即可。
为更好演示DataGrid相关示例,以及提供可参考的数据交互代码,我们提供了示例数据库和一定的服务端代码。
标准页面模板如下:
<!DOCTYPE html />

<html>

<head>

<title>Hello NUI!</title>

 <!--NUI--> <script src="common/nui/nui.js" type="text/javascript"></script>

</head>

<body>

</body>

</html>
示例使用说明(eos)
- 使用
Platform Governor初始化数据库(初始化业务字典等数据,如果已经初始化过则不需要执行此步骤) - 在数据库中执行
examples/dbscripts目录下的数据库脚本初始化示例业务数据 - 在
Platform Governor中部署nui-demo4eos.ecd安装包到eos应用下
示例使用说明(java)
- 在数据库中执行
examples/dbscripts目录下的数据库脚本初始化示例业务数据 - 解压
nui-demo.war文件到tomcat的webapp目录下或直接把该文件部署到tomcat的webapp目录下并启动tomcat - 修改示例应用安装包
WEB-INF\classes目录下的数据库连接配置 文件user-config.properties
示例源码使用说明
- 解压
examples/nui-demo4eos-src.zip或examples/nui-demo-src.zip文件 - 导入到工作空间
# Hello, world!
我们开始编写第一个NUI程序,代码如下:
<!DOCTYPE html /> <html> <head> <title>Hello NUI!</title> <!--NUI--> <script src="common/nui/nui.js" type="text/javascript"></script>

</head> <body>

<input id="helloBtn" class="nui-button" text="Hello" onclick="onHelloClick"/>

<script type="text/javascript"> function onHelloClick(e) { var button = e.sender; nui.alert("Hello NUI!"); } </script>

</body>

</html>
Note:请注意相关javascript和css的路径是否正确。
NUI是基于jQuery开发的javascript控件库,所以依赖jquery.js。jQuery版本1.4+即可。
效果图如下:

本例注意点如下:
- 控件声明:class=”nui-button”
- 属性设置:text=”Hello”
- 事件绑定:onclick=”onHelloClick”
- 事件处理函数:onHelloClick的e是事件对象,e.sender是事件激发者,本例中是button。
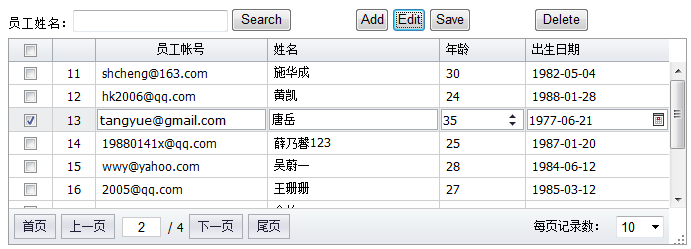
# CRUD
CRUD包括:查询、编辑、新增、删除等数据操作。
效果图如下:
查询数据
首先,我们创建一个数据表格:
<div id="datagrid1" class="nui-datagrid" style="width:700px;height:250px;" url="org.gocom.components.nui.demo.newdataset.impl.TEmployee.queryEmployee.biz.ext" idField="id" allowResize="true" >

<div property="columns">

<div type="indexcolumn"></div>

<div field="loginname" width="120" headerAlign="center" allowSort="true">员工帐号</div>

<div field="name" width="120" allowSort="true">姓名</div>

<div field="age" width="60" allowSort="true">年龄</div>

<div field="birthday" width="100" dateFormat="yyyy-MM-dd">出生日期</div>

</div>

</div>
定义一个search函数,实现查询功能:
function search() {
    var key = document.getElementById("key").value;
    grid.load({ key: key });
}
编辑数据
给需要编辑的列,加上不同的编辑器,代码如下:
<div id="datagrid1" class="nui-datagrid" style="width:700px;height:250px;" url="org.gocom.components.nui.demo.newdataset.impl.TEmployee.queryEmployee.biz.ext" idField="id" allowResize="true" >

<div property="columns"> <div type="indexcolumn"></div>

<div field="loginname" width="120" headerAlign="center" allowSort="true">员工帐号</div>

<div field="name" width="120" allowSort="true">姓名 <!--textbox editor-->

 <input property="editor" class="nui-textbox" style="width:100%;"/> </div>

<div field="age" width="60" allowSort="true">年龄 <!--spinner editor--> <input property="editor" class="nui-spinner" minValue="0" maxValue="200" value="25" style="width:100%;"/> </div>

<div field="birthday" width="100" dateFormat="yyyy-MM-dd">出生日期 <!--datepicker editor--> <input property="editor" class="nui-datepicker" style="width:100%;"/> </div>

</div>

</div>
调用如下”beginEditRow”方法,将选中行进入编辑状态:
function editRow() {
    var row = grid.getSelected();
    if (row) {
        grid.beginEditRow(row);
    }
}
使用ajax将编辑的数据提交到服务端,实现保存功能:
function saveData() {
    var rowsData = grid.getEditData();
    var json = nui.encode(rowsData);

    grid.loading("保存中,请稍后......");
    nui.ajax({
        url: "org.gocom.components.nui.demo.newdataset.impl.TEmployee.queryEmployee.biz.ext",
        data: { employees: json },
        success: function (text) {
            grid.reload();
        },
        error: function (jqXHR, textStatus, errorThrown) {
            alert(jqXHR.responseText);
        }
    });
}
新增记录
使用addRow方法,新增记录后,进行编辑,最后保存。
function addRow() {
    var newRow = {name: "New Row"};
    grid.addRow(newRow, 0);
    grid.beginEditRow(newRow);
}
删除记录
获取选中记录,使用ajax将记录的id发送到后台,进行删除操作:
function deleteRow() {
    var rows = grid.getSelecteds();
    if (rows.length > 0) {
        if (confirm("确定删除选中记录?")) {
            var ids = [];
            for (var i = 0, l = rows.length; i < l; i++) {
                var r = rows[i];
                ids.push(r.id);
            }
            var id = ids.join(',');
            grid.loading("操作中,请稍后......");
            nui.ajax({
                url: "org.gocom.components.nui.demo.newdataset.impl.TEmployee.deleteEmployee.biz.ext" ,
                success: function (text) {
                    grid.reload();
                },
                error: function () {
                }
            });
        }
    } else {
        alert("请选中一条记录");
    }
}
服务端AjaxServer处理
查询数据:
public void SearchEmployees()
{
    //查询条件 string key = Request["key"];
    //分页 int pageIndex = Convert.ToInt32(Request["pageIndex"]);
    int pageSize = Convert.ToInt32(Request["pageSize"]);
    //字段排序 String sortField = Request["sortField"];
    String sortOrder = Request["sortOrder"];

    //业务层:数据库操作 Hashtable result = new TestDB().SearchEmployees(key, pageIndex, pageSize, sortField, sortOrder);

    //JSON String json = PluSoft.Utils.JSON.Encode(result);
    Response.Write(json);
}
保存数据(新增、编辑):
public void SaveEmployees()
{
    String employeesStr = Request["employees"];
    ArrayList employees = (ArrayList)PluSoft.Utils.JSON.Decode(employeesStr);

    foreach (Hashtable employee in employees)
    {
        if (employee["name"] == null) throw new Exception("用户名不能为空");
        if (employee["id"] == null || employee["id"].ToString() == "")
        {
            employee["createtime"] = DateTime.Now;
            new TestDB().InsertEmployee(employee);
        }
        else {
            new TestDB().UpdateEmployee(employee);
        }
    }
}
删除数据:
public void RemoveEmployees()
{
    String idStr = Request["id"];
    if (String.IsNullOrEmpty(idStr)) return;
    String[] ids = idStr.Split(',');
    for (int i = 0, l = ids.Length; i < l; i++)
    {
        string id = ids[i];
        new TestDB().DeleteEmployee(id);
    }
}
# 表单开发
表单开发包括:布局、验证、加载、提交、清除、重置等。
效果图如下:
表单布局
使用HTML Table标签实现任意丰富的表单布局:
<table class="form-table" border="0" cellpadding="1" cellspacing="2">

<tr>

<td class="form-label" style="width:60px;">姓名:</td>

<td style="width:150px"> <input name="name" class="nui-textbox" /> </td>

<td class="form-label" style="width:60px;">地址:</td>

<td style="width:150px"> <input name="addr" class="nui-textbox" /> </td>

</tr>

<tr>

<td class="form-label">性别:</td>

<td > <input name="gender" class="nui-radiobuttonlist" data="[{id: 1, text: '男'}, {id: 2, text: '女'}]"/> </td>

<td class="form-label">年龄:</td> <td > <input name="age" class="nui-spinner" /> </td>

</tr>

<tr>

<td class="form-label">备注:</td>

<td colspan="3" > <input name="remarks" class="nui-textarea" style="width:343px;height:60px;"/> </td>

</tr>

</table>
数据验证
监听处理控件的”validation”事件,自定义验证规则和错误描述信息:
<input id="username" name="username"
    onvalidation="onUserNameValidation" class="nui-textbox" required="true" />
function onUserNameValidation(e) {
    if (e.isValid) {
        if (isEmail(e.value) == false) {
            e.errorText = "必须输入邮件地址";
            e.isValid = false;
        }
    }
}
使用nui.Form组件对多个控件进行验证:
var form = new nui.Form("#form1");
form.validate();
加载表单
nui.ajax({
    url: "org.gocom.components.nui.demo.TForm.loadForm.biz.ext",
    type: "post",
    contentType:"text/json",
    success: function (text) {
        var data = nui.decode(text);   //反序列化成对象 form.setData(data);             //设置多个控件数据 }
});
提交表单
//提交表单数据 var form = new nui.Form("#form1");
var data = form.getData();      //获取表单多个控件的数据 var json = nui.encode(data);   //序列化成JSON nui.ajax({
    url: "org.gocom.components.nui.demo.TForm.saveForm.biz.ext",
    type: "post",
    contentType:"text/json",
    data: { submitData: json },
    success: function (text) {
        alert("提交成功,返回结果:" + text);
    }
});
清除表单
form.clear();
重置表单
form.reset();
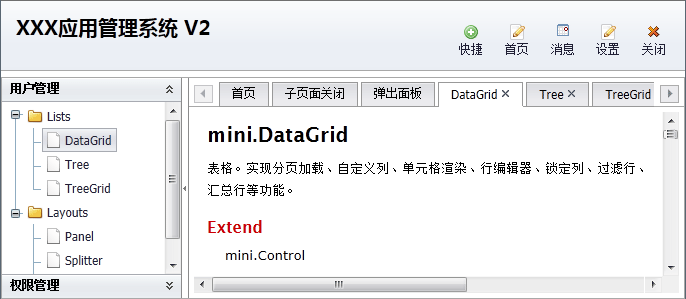
# 主框架布局
下面实现一个最典型主框架布局。
效果图如下:
一:创建界面布局
<!--Layout--> <div id="layout1" class="nui-layout" style="width:100%;height:100%;">

<div class="header" region="north" height="70" showSplit="false" showHeader="false"> </div>

<div title="south" region="south" showSplit="false" showHeader="false" height="30" > </div>

<div title="center" region="center" bodyStyle="overflow:hidden;"> <!--Splitter--> <div class="nui-splitter" style="width:100%;height:100%;" borderStyle="border:0;">

<div size="180" maxSize="250" minSize="100" showCollapseButton="true"> </div>

<div showCollapseButton="false">

</div>

</div>

</div> </div>
其中,Layout实现上、中、下布局;Splitter实现左、右折叠布局。
二:创建OutlookTree
创建OutlookTree控件,放入Splitter左侧区域,作为功能操作树。
<!--OutlookTree--> <div id="leftTree" class="nui-outlooktree" url="../data/outlooktree.txt" onnodeselect="onNodeSelect" textField="text" dataField="treeNodes" idField="id" parentField="pid" >

</div>
url从服务端返回JSON格式如下:
{treeNodes:
[
    {id: "user", text: "用户管理"},
    {id: "lists", text: "Lists", pid: "user" },
    {id: "datagrid", text: "DataGrid", pid: "lists"},
    {id: "tree", text: "Tree" , pid: "lists"},
    ......
]
}
通过 “id” 和 “pid” 组成树形结构,在创建OutlookTree时注意设置 “idField” 和 “parentField” 。
三:创建Tabs
创建Tabs控件,放入Splitter右侧区域,作为主操作区域。
<!--Tabs--> <div id="mainTabs" class="nui-tabs bg-toolbar" activeIndex="0" style="width:100%;height:100%;" bodyStyle="border:0;background:white;" >

<div title="首页" url="../../docs/api/overview.jsp" > </div> </div>
四:监听处理”nodeselect”事件
function showTab(node) {
    var tabs = nui.get("mainTabs");
    var id = "tab$" + node.id;
    var tab = tabs.getTab(id);
    if (!tab) {
        tab = {};
        tab.name = id;
        tab.title = node.text;
        tab.showCloseButton = true;
        tab.url = node.url;
        tabs.addTab(tab);
    }
    tabs.activeTab(tab);
}

function onNodeSelect(e) {
    var node = e.node;
    var isLeaf = e.isLeaf;

    if (isLeaf) {
        showTab(node);
    }
}
# 主框架布局
# OutlookTree
一:创建界面布局
<!--Layout--> <div id="layout1" class="nui-layout" style="width:100%;height:100%;"> <div class="header" region="north" height="70" showSplit="false" showHeader="false"> </div>

<div title="south" region="south" showSplit="false" showHeader="false" height="30" > </div>

<div title="center" region="center" bodyStyle="overflow:hidden;"> <!--Splitter--> <div class="nui-splitter" style="width:100%;height:100%;" borderStyle="border:0;">

<div size="180" maxSize="250" minSize="100" showCollapseButton="true"> </div> <div showCollapseButton="false"> </div>

</div> </div> </div>
其中,Layout实现上、中、下布局;Splitter实现左、右折叠布局。
二:创建OutlookTree
创建OutlookTree控件,放入Splitter左侧区域,作为功能操作树。
<!--OutlookTree--> <div id="leftTree" class="nui-outlooktree" url="../data/outlooktree.txt" onnodeselect="onNodeSelect" textField="text" dataField="outlooktrees" idField="id" parentField="pid" > </div>
url从服务端返回JSON格式如下:
{outlooktrees:
[
    {id: "user", text: "用户管理"},
    {id: "lists", text: "Lists", pid: "user" },
    {id: "datagrid", text: "DataGrid", pid: "lists"},
    {id: "tree", text: "Tree" , pid: "lists"},
    ......
]
}
通过 “id” 和 “pid” 组成树形结构,在创建OutlookTree时注意设置 “idField” 和 “parentField” 。
三:创建Tabs
创建Tabs控件,放入Splitter右侧区域,作为主操作区域。
<!--Tabs--> <div id="mainTabs" class="nui-tabs bg-toolbar" activeIndex="0" style="width:100%;height:100%;" bodyStyle="border:0;background:white;" >

<div title="首页" url="../../docs/api/overview.html" > </div> </div>
四:监听处理”nodeselect”事件
function showTab(node) {
    var tabs = nui.get("mainTabs");
    var id = "tab$" + node.id;
    var tab = tabs.getTab(id);
    if (!tab) {
        tab = {};
        tab.name = id;
        tab.title = node.text;
        tab.showCloseButton = true;
        tab.url = node.url;
        tabs.addTab(tab);
    }
    tabs.activeTab(tab);
}

function onNodeSelect(e) {
    var node = e.node;
    var isLeaf = e.isLeaf;

    if (isLeaf) {
        showTab(node);
    }
}
# OutlookMenu
一:创建界面布局
<!--Layout--> <div id="layout1" class="nui-layout" style="width:100%;height:100%;"> <div class="header" region="north" height="70" showSplit="false" showHeader="false"> </div>

<div title="south" region="south" showSplit="false" showHeader="false" height="30" > </div>

<div title="center" region="center" bodyStyle="overflow:hidden;"> <!--Splitter--> <div class="nui-splitter" style="width:100%;height:100%;" borderStyle="border:0;">

<div size="180" maxSize="250" minSize="100" showCollapseButton="true"> </div> <div showCollapseButton="false"> </div>

</div> </div> </div>
其中,Layout实现上、中、下布局;Splitter实现左、右折叠布局。
二:创建OutlookMenu
创建OutlookMenu控件,放入Splitter左侧区域,作为功能操作树。
<!--OutlookMenu--> <div class="nui-outlookmenu" url="../data/outlookmenu.txt" onitemselect="onItemSelect" idField="id" parentField="pid" textField="text" > </div>
url从服务端返回JSON格式如下:
{outlookmenus:
[
    { id: "user", text: "用户管理"},
    { id: "addUser", pid: "user", text: "增加用户", iconCls: "icon-add", url: "../navbartree/navbartree.html" },
    { id: "editUser", pid: "user", text: "修改用户", iconCls: "icon-edit", url: "../buttonedit/openwindow.html" },
    { id: "removeUser", pid: "user", text: "删除用户", iconCls: "icon-remove", url: "../datagrid/datagrid.html" },

    { id: "right", text: "权限管理"},
    { id: "addRight", pid: "right", text: "查询权限", iconCls: "Note", url: "../navbartree/navbartree.html", iconPosition: "top" },
    { id: "editRight", pid: "right", text: "操作权限", iconCls: "Reports", url: "../buttonedit/openwindow.html", iconPosition: "top" }
]
}
通过 “id” 和 “pid” 组成树形结构,在创建OutlookMenu时注意设置 “idField” 和 “parentField” 。
三:创建IFrame
在Splitter右侧区域加入一个IFrame元素,作为主操作区域。
<iframe id="mainframe" frameborder="0" name="main" style="width:100%;height:100%;" border="0"></iframe>
四:监听处理”itemselect”事件
var iframe = document.getElementById("mainframe");
iframe.src = "../datagrid/datagrid.html#1" function onItemSelect(e) {
    var item = e.item;
    iframe.src = item.url;
}
# Tree
一:创建界面布局
<!--Layout--> <div id="layout1" class="nui-layout" style="width:100%;height:100%;"> <div class="header" region="north" height="70" showSplit="false" showHeader="false"> </div>

<div title="south" region="south" showSplit="false" showHeader="false" height="30" > </div>

<div title="center" region="center" bodyStyle="overflow:hidden;"> <!--Splitter--> <div class="nui-splitter" style="width:100%;height:100%;" borderStyle="border:0;">

<div size="180" maxSize="250" minSize="100" showCollapseButton="true"> </div> <div showCollapseButton="false"> </div>

</div> </div> </div>
其中,Layout实现上、中、下布局;Splitter实现左、右折叠布局。
二:创建Tree
创建Tree控件,放入Splitter左侧区域,作为功能操作树。
<!--Tree--> <ul id="tree1" class="nui-tree" url="../data/listTree.txt" style="width:100%;height:100%;" showTreeIcon="true" textField="text" idField="id" resultAsTree="false" onnodeselect="onNodeSelect" > </ul>
url从服务端返回JSON格式如下:
{trees:
[
    {id: "base", text: "Base", expanded: false},
    {id: "ajax", text: "Ajax", pid: "base"},
    {id: "json", text: "JSON", pid: "base"},
    {id: "date", text: "Date", pid: "base"},
    {id: "control", text: "Control", pid: "base"},
    ......
]
}
通过 “id” 和 “pid” 组成树形结构,在创Tree时注意设置 “idField” 、 “parentField” 和 “resultAsTree” 属性。
三:创建Tabs
创建Tabs控件,放入Splitter右侧区域,作为主操作区域。
<!--Tabs--> <div id="mainTabs" class="nui-tabs bg-toolbar" activeIndex="0" style="width:100%;height:100%;" bodyStyle="border:0;background:white;" >

<div title="首页" url="../../docs/api/overview.html" > </div> </div>
四:监听处理”nodeselect”事件
function showTab(node) {
    var tabs = nui.get("mainTabs");
    var id = "tab$" + node.id;
    var tab = tabs.getTab(id);
    if (!tab) {
        tab = {};
        tab.name = id;
        tab.title = node.text;
        tab.showCloseButton = true;
        tab.url = node.url;
        tabs.addTab(tab);
    }
    tabs.activeTab(tab);
}

function onNodeSelect(e) {
    var node = e.node;
    var isLeaf = e.isLeaf;

    if (isLeaf) {
        showTab(node);
    }
}
# Menu
一:创建界面布局
<!--Layout--> <div id="layout1" class="nui-layout" style="width:100%;height:100%;">

<div class="header" region="north" height="70" showSplit="false" showHeader="false"> </div>

<div title="south" region="south" showSplit="false" showHeader="false" height="30" > </div>

<div title="center" region="center" bodyStyle="overflow:hidden;"> <!--Splitter--> <div class="nui-splitter" style="width:100%;height:100%;" borderStyle="border:0;">

<div size="180" maxSize="250" minSize="100" showCollapseButton="true"> </div>

<div showCollapseButton="false"> </div>

</div> </div>

</div>
其中,Layout实现上、中、下布局;Splitter实现左、右折叠布局。
二:创建Menu
创建Menu控件,放入顶部区域,作为功能操作项。
<ul id="menu1" class="nui-menubar" style="width:100%;" url="../data/listTree.txt" onitemclick="onItemClick" textField="text" dataField="treeNodes" idField="id" parentField="pid" > </ul>
url从服务端返回JSON格式如下:
{treeNodes:
[
    {id: "base", text: "Base", expanded: false},
    {id: "ajax", text: "Ajax", pid: "base"},
    {id: "json", text: "JSON", pid: "base"},
    {id: "date", text: "Date", pid: "base"},
    {id: "control", text: "Control", pid: "base"},
    ......
]
}
通过 “id” 和 “pid” 组成树形结构,在创Tree时注意设置 “idField” 、 “parentField” 属性。
三:创建Tabs
创建Tabs控件,放入Splitter右侧区域,作为主操作区域。
<!--Tabs--> <div id="mainTabs" class="nui-tabs bg-toolbar" activeIndex="0" style="width:100%;height:100%;" bodyStyle="border:0;background:white;" >

<div title="首页" url="../../docs/api/overview.html" > </div> </div>
四:监听处理”itemclick”事件
function showTab(node) {
    var tabs = nui.get("mainTabs");
    var id = "tab$" + node.id;
    var tab = tabs.getTab(id);
    if (!tab) {
        tab = {};
        tab.name = id;
        tab.title = node.text;
        tab.showCloseButton = true;
        tab.url = node.url;
        tabs.addTab(tab);
    }
    tabs.activeTab(tab);
}
function onItemClick(e) {
    var item = e.item;
    var isLeaf = e.isLeaf;
    if (isLeaf) {
        showTab(item);
    }
}
# CURD
# 4.1.单元格编辑
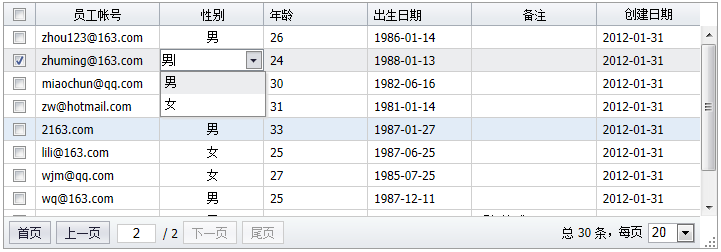
一:创建单元格编辑器
<div id="datagrid1" class="nui-datagrid" style="width:800px;height:280px;" url="org.gocom.components.nui.demo.newdataset.impl.TEmployee.queryEmployee.biz.ext" idField="id" allowResize="true" pageSize="20" allowCellEdit="true" allowCellSelect="true" multiSelect="true" > <div property="columns"> <div type="checkcolumn"></div> <div field="loginname" width="120" headerAlign="center" allowSort="true">员工帐号
            <input property="editor" class="nui-textbox" style="width:100%;"/> </div> <div field="gender" width="100" renderer="onGenderRenderer" align="center" headerAlign="center">性别
            <input property="editor" class="nui-combobox" style="width:100%;" data="Genders"/> </div> <div field="age" width="100" allowSort="true" >年龄
            <input property="editor" class="nui-spinner" minValue="0" maxValue="200" value="25" style="width:100%;"/> </div> <div field="birthday" width="100" allowSort="true" dateFormat="yyyy-MM-dd">出生日期
            <input property="editor" class="nui-datepicker" style="width:100%;"/> </div> <div field="remarks" width="120" headerAlign="center" allowSort="true">备注
            <input property="editor" class="nui-textarea" style="width:100%;" minHeight="80"/> </div> <div field="createtime" width="100" headerAlign="center" dateFormat="yyyy-MM-dd" allowSort="true">创建日期</div> </div> </div>
设置allowCellEdit和allowCellSelect后,表格为单元格编辑模式。
二:编辑操作
增加行:
function addRow() {
    var newRow = { name: "New Row" };
    grid.addRow(newRow, 0);
}
删除行:
function removeRow() {
    var rows = grid.getSelecteds();
    if (rows.length > 0) {
        grid.removeRows(rows, true);
    }
}
保存数据:
function saveData() {
    //获得增加、删除、修改的记录集合 var data = grid.getChanges();
    var json = nui.encode(data);
    grid.loading("保存中,请稍后......");
    nui.ajax({
        url: "org.gocom.components.nui.demo.newdataset.impl.TEmployee.saveEmployee.biz.ext",
        data: { data: json },
        contentType:'text/json',
        type: "post",
        success: function (text) {
            grid.reload();
        },
        error: function (jqXHR, textStatus, errorThrown) {
            alert(jqXHR.responseText);
        }
    });
}
三:服务端处理
public void SaveChangedEmployees()
{
    String json = Request["data"];
    ArrayList rows = (ArrayList)PluSoft.Utils.JSON.Decode(json);

foreach (Hashtable row in rows)
    {
        //根据记录状态,进行不同的增加、删除、修改操作 String state = row["_state"] != null ? row["_state"].ToString() : "";
        if(state == "added")
        {
            row["createtime"] = DateTime.Now;
            new TestDB().InsertEmployee(row);
        }
        else if (state == "removed" || state == "deleted")
        {
            String id = row["id"].ToString();
            new TestDB().DeleteEmployee(id);
        }
        else if (state == "modified")
        {
            new TestDB().UpdateEmployee(row);
        }
    }
}
# 行编辑
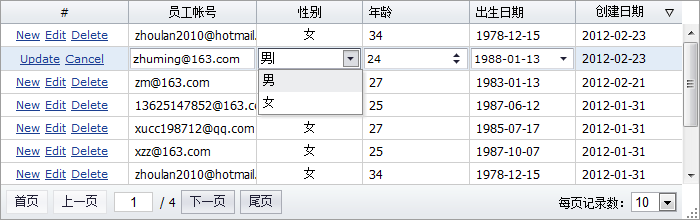
一:创建单元格编辑器
<div id="datagrid1" class="nui-datagrid" style="width:700px;height:280px;" url="org.gocom.components.nui.demo.newdataset.impl.TEmployee.queryEmployee.biz.ext" > <div property="columns"> <div name="action" width="120" headerAlign="center" align="center" renderer="onActionRenderer" cellStyle="padding:0;">#</div> <div field="loginname" width="120" headerAlign="center" allowSort="true">员工帐号
            <input property="editor" class="nui-textbox" /> </div> <div field="gender" width="100" allowSort="true" renderer="onGenderRenderer" align="center" headerAlign="center">性别
            <input property="editor" class="nui-combobox" style="width:100%;" data="[{id:1,text:'男'}, {id:2, text: '女'}]"/> </div> <div field="age" width="100" allowSort="true">年龄
            <input property="editor" class="nui-spinner" minValue="0" maxValue="200" value="25" style="width:100%;"/> </div> <div field="birthday" width="100" allowSort="true" dateFormat="yyyy-MM-dd">出生日期
            <input property="editor" class="nui-datepicker" style="width:100%;"/> </div> <div field="createtime" width="100" headerAlign="center" dateFormat="yyyy-MM-dd" allowSort="true">创建日期</div> </div> </div>
比如:nui-textbox的property为”editor”,表示是此列的编辑器。
二:编辑操作
开始编辑行:
grid.beginEditRow(row);
取消编辑:
grid.cancelEdit();
提交编辑数据:
var rowData = grid.getEditRowData(row);
grid.loading("保存中,请稍后......");
var json = nui.encode([rowData]);
nui.ajax({
    url: "org.gocom.components.nui.demo.newdataset.impl.TEmployee.saveEmployee.biz.ext",
    data: { employees: json },
    contentType:"text/json"
    success: function (text) {
        grid.reload();
    },
    error: function (jqXHR, textStatus, errorThrown) {
        alert(jqXHR.responseText);
    }
});
# 行内表单编辑
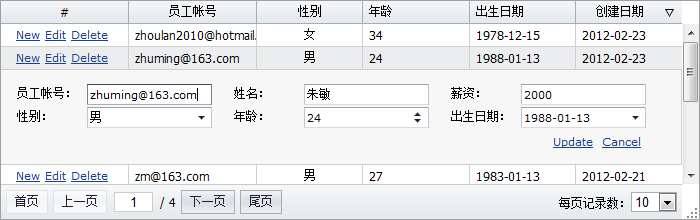
一:创建编辑表单
<div id="editForm1" style="display:none;padding:5px;position:relative;"> <input class="nui-hidden" name="id"/> <table style="width:100%;"> <tr> <td style="width:80px;">员工帐号:</td> <td style="width:150px;"><input name="loginname" class="nui-textbox" /></td> <td style="width:80px;">姓名:</td> <td style="width:150px;"><input name="name" class="nui-textbox" /></td> <td style="width:80px;">薪资:</td> <td style="width:150px;"><input name="salary" class="nui-textbox" /></td> </tr> <tr> <td>性别:</td> <td><input name="gender" class="nui-combobox" data="Genders"/></td> <td>年龄:</td> <td><input name="age" class="nui-spinner" minValue="0" maxValue="200" value="25" /></td> <td>出生日期:</td> <td><input name="birthday" class="nui-datepicker" /></td> </tr> <tr> <td style="text-align:right;padding-top:5px;padding-right:20px;" colspan="6"> <a class="Update_Button" href="javascript:updateRow();">Update</a> <a class="Cancel_Button" href="javascript:cancelRow();">Cancel</a> </td> </tr> </table> </div>
二:嵌入详细行
//显示行详细 grid.hideAllRowDetail();
grid.showRowDetail(row);
//将editForm元素,加入行详细单元格内 var td = grid.getRowDetailCellEl(row);
td.appendChild(editForm);
editForm.style.display = "";
三:加载表单
var form = new nui.Form("editForm1");
if (grid.isNewRow(row)) {
    form.reset();
} else {
    form.loading();
    nui.ajax({
        url: "org.gocom.components.nui.demo.newdataset.impl.TEmployee.queryEmployee.biz.ext" ,
        success: function (text) {
            var o = nui.decode(text);
            form.setData(o);

            form.unmask();
        }
    });
}
三:提交表单
var form = new nui.Form("editForm1");
var o = form.getData();
grid.loading("保存中,请稍后......");
var json = nui.encode([o]);
nui.ajax({
    url: "org.gocom.components.nui.demo.newdataset.impl.TEmployee.saveEmployee.biz.ext",
    data: { employees: json },
    contentType:'text/json'
    success: function (text) {
        grid.reload();
    },
    error: function (jqXHR, textStatus, errorThrown) {
        alert(jqXHR.responseText);
    }
});
# 弹出面板编辑
一:创建弹出编辑面板
<div id="editWindow" class="nui-window" title="Window" style="width:650px;" showModal="true" allowResize="true" allowDrag="true" > <div id="editform" class="form" > <input class="nui-hidden" name="id"/> <table style="width:100%;"> <tr> <td style="width:80px;">员工帐号:</td> <td style="width:150px;"><input name="loginname" class="nui-textbox" /></td> <td style="width:80px;">姓名:</td> <td style="width:150px;"><input name="name" class="nui-textbox" /></td> <td style="width:80px;">薪资:</td> <td style="width:150px;"><input name="salary" class="nui-textbox" /></td> </tr> <tr> <td>性别:</td> <td><input name="gender" class="nui-combobox" url="/nui/demo/data/genders.txt"/></td> <td>年龄:</td> <td><input name="age" class="nui-spinner" minValue="0" maxValue="200" value="25" /></td> <td>出生日期:</td> <td><input name="birthday" class="nui-datepicker" /></td> </tr> <tr> <td style="text-align:right;padding-top:5px;padding-right:20px;" colspan="6"> <a class="Update_Button" href="javascript:updateRow()">Update</a> <a class="Cancel_Button" href="javascript:cancelRow()">Cancel</a> </td> </tr> </table> </div> </div>
二:面板操作
弹出加载面板数据:
var editWindow = nui.get("editWindow");
editWindow.show();
var form = new nui.Form("#editform");
form.loading();
nui.ajax({
    url: "org.gocom.components.nui.demo.newdataset.impl.TEmployee.getEmployee.biz.ext" ,
    success: function (text) {
        var o = nui.decode(text);
        form.setData(o);
        form.unmask();
    },
    error: function () {
        alert("表单加载错误");
    }
});
保存提交面板数据:
var form = new nui.Form("#editform");
var o = form.getData();

grid.loading("保存中,请稍后......");
var json = nui.encode([o]);
nui.ajax({
    url: "org.gocom.components.nui.demo.newdataset.impl.TEmployee.saveEmployee.biz.ext",
    data: { employees: json },
    contentType:"text/json"
    success: function (text) {

        grid.reload();
    },
    error: function (jqXHR, textStatus, errorThrown) {
        alert(jqXHR.responseText);
    }
});

editWindow.hide();
# 表单控件
# DataBinding:数据绑定
数据绑定
数据绑定后:当表格变化时,控件值跟随变动;控件值修改时,表格单元格内容变动。 最后使用表格的数据提交保存,达到:多次修改、一次保存的效果。
//绑定表单 var db = new nui.DataBinding();
db.bindForm("editForm1", grid);

//绑定控件 db.bindField(textbox, grid, "username");
# 表单:加载、保存

创建表单
只需要一个id即可创建表单对象:
var form = new nui.Form("#form1");
加载表单
nui.ajax({
    url: "org.gocom.components.nui.demo.TForm.loadForm.biz.ext",
    type: "post",
    contentType: "text/json",
    success: function (text) {
        var data = nui.decode(text);   //反序列化成对象 form.setData(data);             //设置多个控件数据 }
});
提交表单
//提交表单数据 var form = new nui.Form("#form1");
var data = {forms:form.getData()};      //获取表单多个控件的数据 var json = nui.encode(data);   //序列化成JSON nui.ajax({
    url: "org.gocom.components.nui.demo.TForm.saveForm.biz.ext",
    type: "post",
    contentType: "text/json",
    data:json ,
    success: function (text) {
        alert("提交成功,返回结果:" + nui.encode(text.returnForms));
    }
});
清除表单
form.clear();
重置表单
form.reset();
# 表单验证
绑定validation事件
<input id="username" name="username" onvalidation="onUserNameValidation" class="nui-textbox" required="true" />
function onUserNameValidation(e) {
    if (e.isValid) {
        if (isEmail(e.value) == false) {
            e.errorText = "必须输入邮件地址";
            e.isValid = false;
        }
    }
}
validation事件是实现验证的基础。
设置vtype
<input class="nui-textbox" vtype="email"/>
TextBox内置了vtype属性,有如下验证规则:email、url、int、float、maxLength、minLength、rangeLength、rangeChar、range、date等。
验证表单
var form = new nui.Form("#form1");
    form.validate();
    if(form.isValid()){
        alert("验证成功");
    }
# 表单:控件尺寸调整
宽度调整
可以在style中直接设置:
<input class="nui-textbox" style="width:200px;"/>
高度调整
如果需要调整按钮、输入框、下拉框、日期框等控件的高度,需要通过CSS样式,如下代码:
// button .nui-button-text {
    padding-top:1px;
    padding-bottom:2px;
    padding-top:3px\9;
    padding-bottom:1px\9;
}
// textbox .nui-textbox {
    height:19px;
}
.nui-textbox-input {
    height:17px;
    line-height:15px;
}
// buttonedit .nui-buttonedit {
    height:19px;
}
.nui-buttonedit-border {
    height:17px;
}
.nui-buttonedit-input {
    height:17px;
    line-height:15px;
}
.nui-buttonedit-button {
    height:13px;
}
.nui-buttonedit-icon {

    width:15px;
    height:14px;
}
.nui-datepicker .nui-buttonedit-icon {
    background-position:50% 1px;
}
# 弹出:选择表格
nui.open
nui.open({
    url: "/nui/demo/CommonLibs/SelectGridWindow.jsp",
    title: "选择列表",
    width: 650,
    height: 380,
    ondestroy: function (action) {
        if (action == "ok") {
            var iframe = this.getIFrameEl();
            var data = iframe.contentWindow.GetData();
            data = nui.clone(data);    //必须 btnEdit.setValue(data.id);
            btnEdit.setText(data.name);
        }
    }
});
# 弹出:选择树
nui.open
nui.open({
    url: bootPATH + "../demo/CommonLibs/SelectTreeWindow.html",
    showMaxButton: false,
    title: "选择树",
    width: 350,
    height: 350,
    ondestroy: function (action) {
        if (action == "ok") {
            var iframe = this.getIFrameEl();
            var data = iframe.contentWindow.GetData();
            data = nui.clone(data);
            if (data) {
                btnEdit.setValue(data.id);
                btnEdit.setText(data.text);
            }
        }
    }
});
# Button:按钮
创建按钮
<h4>Only Text</h4> <a class="nui-button" onclick="onClick" enabled="false" >增加</a> <a class="nui-button" onclick="onClick" >修改</a> <h4>Text and Icon</h4> <a class="nui-button" iconCls="icon-add" onclick="onClick" >增加</a> <a class="nui-button nui-button-iconRight" iconCls="icon-edit" onclick="onClick" >修改</a> <h4>Only Icon</h4> <a class="nui-button" iconCls="icon-add" onclick="onClick"></a> <a class="nui-button" iconCls="icon-edit" onclick="onClick"></a> <h4>Plain</h4> <a class="nui-button" plain="true" iconCls="icon-add" onclick="onClick">增加</a> <a class="nui-button" plain="true" iconCls="icon-edit" onclick="onClick">修改</a> <a class="nui-button" plain="true" iconCls="icon-remove" onclick="onClick">删除</a> <h4>Icon Position</h4> <a class="nui-button nui-button-iconTop" iconCls="icon-add" onclick="onClick" >增加</a> <a class="nui-button nui-button-iconTop" iconCls="icon-edit" onclick="onClick" >修改</a> <h4>A Link</h4> <a class="nui-button" href="http://www.google.com">Google</a> <a class="nui-button" href="http://www.baidu.com">Baidu</a>
菜单按钮
<a class="nui-menubutton" menu="#popupMenu" >选择...</a> <ul id="popupMenu" class="nui-menu" style="display:none;"> <li> <span >操作</span> <ul> <li iconCls="icon-new" onclick="onItemClick">新建</li> <li class="separator"></li> <li iconCls="icon-add" onclick="onItemClick">增加</li> <li iconCls="icon-edit" onclick="onItemClick">修改</li> <li iconCls="icon-remove" onclick="onItemClick">删除</li> </ul> </li> <li class="separator"></li> <li iconCls="icon-open" >打开</li> <li iconCls="icon-remove" >关闭</li> </ul>
工具栏
<div class="nui-toolbar"> <a class="nui-button" iconCls="icon-add">增加</a> <a class="nui-button" iconCls="icon-edit">修改</a> <a class="nui-button" iconCls="icon-remove">删除</a> <span class="separator"></span> <a class="nui-button" plain="true">增加</a> <a class="nui-button" plain="true">修改</a> <a class="nui-button" plain="true">删除</a> <span class="separator"></span> <input class="nui-textbox" /> <a class="nui-button" plain="true">查询</a> </div>
# ButtonEdit:按钮输入框
创建ButtonEdit
<input id="btnEdit1" class="nui-buttonedit" onbuttonclick="onButtonEdit"/>
buttonclick事件
nui.ajax({
    url: "org.gocom.components.nui.demo.TForm.loadForm.biz.ext",
    type: "post",
    contentType: "text/json",
    success: function (text) {
        var data = nui.decode(text);   //反序列化成对象 form.setData(data);             //设置多个控件数据 }
});
提交表单
function onButtonEdit(e) {
    alert("弹出选择");
}
# TextBox:文本输入框
创建代码
单行输入框:<input class="nui-textbox" value="0" /> <br /><br /> 密码输入框:<input class="nui-password" value="12345" /> <br /><br /> 多行输入框:<input class="nui-textarea" value="中国" /> <br />
# ComboBox:下拉选择框
创建ComboBox
<input id="combo1" class="nui-combobox" style="width:150px;" textField="text" valueField="id" url="../data/countrys.txt" dataField=countrys value="cn" showNullItem="true" />
多选 + 多列
<div class="nui-combobox" style="width:250px;" popupWidth="400" textField="text" valueField="id" url="../data/countrys.txt" dataField=countrys value="cn,usa" multiSelect="true" > <div property="columns"> <div header="ID" field="id"></div> <div header="国家" field="text"></div> </div> </div>
# ComboBox:联动选择
一:创建两个ComboBox
<span>部门</span><br /> <input id="deptCombo" class="nui-combobox" style="width:150px;" textField="name" valueField="id" onvaluechanged="onDeptChanged" url="org.gocom.components.nui.demo.newdataset.impl.TDepartment.getDepartment.biz.ext" dataField="department" showNullItem="true" /> <br /><br /> <span>职位</span><br /> <input id="positionCombo" class="nui-combobox" style="width:150px;" textField="name" valueField="id" />
二:valuechanged加载第二个ComboBox
function onDeptChanged(e) {
    var id = deptCombo.getValue();
    positionCombo.setValue("");
    var url = "org.gocom.components.nui.demo.newdataset.impl.TPosition.getPosition.biz.ext
    positionCombo.setUrl(url);
}
# DatePicker:日期选择框
创建DatePicker
只需要一个id即可创建表单对象:
<input id="date1" class="nui-datepicker" />
Date & Time
<input id="date2" class="nui-datepicker" style="width:200px;" format="yyyy-MM-dd H:mm" showTime="true" />
# Spinner:数字输入框
创建Spinner
<input id="sp1" class="nui-spinner" minValue="200" maxValue="250"/>
# TreeSelect:树形选择框
创建TreeSelect
<input id="select1" class="nui-treeselect" url="../data/listTree.txt" textField="text" dataField="treeNodes" valueField="id" parentField="pid" />
数据结构
{treeNodes:
[
    {id: "base", text: "Base", expanded: false},
    {id: "ajax", text: "Ajax", pid: "base"},
    {id: "json", text: "JSON", pid: "base"},
    {id: "date", text: "Date", pid: "base"},
    {id: "control", text: "Control", pid: "base"},
    {id: "forms", text: "Forms", expanded: false},
    {id: "button", text: "Button", pid: "forms"},
    {id: "listbox", text: "ListBox", pid: "forms"},
    {id: "checkboxlist", text: "CheckBoxList", pid: "forms"},
    {id: "lists", text: "Lists", expanded: false},
    {id: "datagrid", text: "DataGrid", pid: "lists"},
    {id: "tree", text: "Tree", pid: "lists"},
    {id: "treegrid", text: "TreeGrid ", pid: "lists"},
    {id: "layouts", text: "Layouts", expanded: false},
    {id: "panel", text: "Panel", pid: "layouts"},
    {id: "splitter", text: "Splitter", pid: "layouts"},
    {id: "layout", text: "Layout ", pid: "layouts"},
    {id: "navigations", text: "Navigations", expanded: false},
    {id: "pager", text: "Pager", pid: "navigations"},
    {id: "tabs", text: "Tabs", pid: "navigations"},
    {id: "navbar", text: "OutlookBar", pid: "navigations"},
    {id: "menu", text: "Menu", pid: "navigations"}
]
}
# AutoComplete:输入智能提示框
创建AutoComplete
<input id="tbl1" class="nui-autocomplete" required="true" style="width:200px;" valueField="id" textField="text" url="org.gocom.components.nui.demo.TCountry.queryCountry.biz.ext"
    dataField="countrys" value="cn" text="中国" />
数据结构
{countrys:
[
    { id: "usa", text: "美国" },
    { id: "cn", text: "中国" },
    { id: "jp", text: "日本" },
    { id: "en", text: "英国" },
    { id: "de", text: "德国" },
    { id: "fr", text: "法国" },
    { id: "ca", text: "加拿大" },
    { id: "at", text: "奥地利" },
    { id: "ch", text: "瑞士" }
]
}
# TextBoxList:多选输入智能提示框
创建TextBoxList
<input id="tbl1" class="nui-textboxlist" required="true" style="width:250px;" url="org.gocom.components.nui.demo.TCountry.queryCountry.biz.ext" value="cn,usa" text="中国,美国" dataField="countrys" valueField="id" textField="text" onvaluechanged="onValueChanged" />
数据结构
{countrys:
[
    { id: "usa", text: "美国" },
    { id: "cn", text: "中国" },
    { id: "jp", text: "日本" },
    { id: "en", text: "英国" },
    { id: "de", text: "德国" },
    { id: "fr", text: "法国" },
    { id: "ca", text: "加拿大" },
    { id: "at", text: "奥地利" },
    { id: "ch", text: "瑞士" }
]
}
# CheckBox:复选框
创建CheckBox
<div id="ck1" name="product" class="nui-checkbox" checked="true" text="NUI CheckBox" ></div>
# ListBox:列表控件
创建ListBox
<div id="listbox1" class="nui-listbox" style="width:150px;height:100px;" textField="text" dataField="countrys" valueField="id" url="../data/countrys.txt"> </div>
多列
<div id="listbox2" class="nui-listbox" style="width:400px;height:120px;" value="cn" onvaluechanged="onListBoxValueChanged" url="../data/countrys.txt" dataField="countrys" showCheckBox="true" multiSelect="true" > <div property="columns"> <div header="ID" field="id"></div> <div header="国家" field="text"></div> </div> </div>
# CheckBoxList:复选框组
创建CheckBoxList
<div id="cbl1" class="nui-checkboxlist" repeatItems="3" repeatLayout="table" textField="text" valueField="id" value="cn,usa" onload="onLoad" url="../data/countrys.txt" dataField="countrys" > </div>
数据结构
{countrys:
[
    { id: "usa", text: "美国" },
    { id: "cn", text: "中国" },
    { id: "jp", text: "日本" },
    { id: "en", text: "英国" },
    { id: "de", text: "德国" },
    { id: "fr", text: "法国" },
    { id: "ca", text: "加拿大" },
    { id: "at", text: "奥地利" },
    { id: "ch", text: "瑞士" }
]
}
# RadioButtonList:单选框组
创建RadioButtonList
<div id="rbl" class="nui-radiobuttonlist" repeatItems="2" repeatLayout="table" repeatDirection="vertical" textField="text" dataField="countrys" valueField="id" value="cn" url="../data/countrys.txt" > </div>
数据结构
{countrys:
    [
        { id: "usa", text: "美国" },
        { id: "cn", text: "中国" },
        { id: "jp", text: "日本" },
        { id: "en", text: "英国" },
        { id: "de", text: "德国" },
        { id: "fr", text: "法国" },
        { id: "ca", text: "加拿大" },
        { id: "at", text: "奥地利" },
        { id: "ch", text: "瑞士" }
    ]
}
# FileUpload:文件上传控件
创建FileUpload
<input id="fileupload1" class="nui-fileupload" name="Fdata" limitType="`*.txt`" flashUrl="swfupload/swfupload.swf" uploadUrl="upload.jsp" onuploadsuccess="onUploadSuccess" />
服务端处理
// 获得程序路径 string tempFile = Request.PhysicalApplicationPath;

//找到目标文件对象 HttpPostedFile uploadFile = Request.Files["Fdata"];

// 如果有文件, 则保存到一个地址 if (uploadFile.ContentLength > 0)
{
    uploadFile.SaveAs(string.Format("{0}{1}{2}", tempFile, "demo\\fileUpload\\upload\\", uploadFile.FileName));
}

Response.Write(uploadFile.FileName +"("+DateTime.Now+")");    //可以返回一个JSON字符串, 在客户端做更多处理
# 表格控件
# 表格:分页查询
一:创建表格
<div id="datagrid1" class="nui-datagrid" style="width:700px;height:280px;" url="org.gocom.components.nui.demo.newdataset.impl.TEmployee.queryEmployee.biz.ext" dataField="data"idField="id" allowResize="true" >

<div property="columns">

<div type="indexcolumn" ></div>

<div field="loginname" width="120" headerAlign="center" allowSort="true">员工帐号</div>

<div field="name" width="120" headerAlign="center" allowSort="true">姓名</div>

<div field="gender" width="100" renderer="onGenderRenderer" align="center" headerAlign="center">性别</div>

<div field="salary" width="100" allowSort="true">薪资</div>

<div field="age" width="100" allowSort="true">年龄</div>

<div field="createtime" width="100" headerAlign="center" dateFormat="yyyy-MM-dd" allowSort="true">创建日期</div>

</div>

</div>
二:数据加载
条件加载:
//从界面表单元素获取查询条件 grid.load({
    name: document.getElementById("key").value,
    date: document.getElementById("date").value
});
分页导航:
grid.gotoPage(1, 10); //跳转到第二页,每页20条数据
字段排序:
//对"createtime"字段,进行降级排序 grid.sortBy("createtime", "desc");
三:服务端处理
//查询条件 string key = Request["name"];
//分页 int pageIndex = Convert.ToInt32(Request["pageIndex"]);
int pageSize = Convert.ToInt32(Request["pageSize"]);
//字段排序 String sortField = Request["sortField"];
String sortOrder = Request["sortOrder"];

//数据库操作:使用查询条件、分页、排序等参数进行查询 Hashtable result = SearchEmployees(key, pageIndex, pageSize, sortField, sortOrder);

//返回JSON:将查询的结果,序列化为JSON字符串返回 String json = PluSoft.Utils.JSON.Encode(result);
Response.Write(json);
四:数据结构
在服务端处理后,获得的JSON结构如下:
{
    total: 100,     //总记录数 data: [         //分页后的数组数据 { ... },
        { ... },
        ...
    ]
}
# 表格:自定义列
表格列配置集合( columns ),是一个数组,如:[column, column, ...]。其中一个column的配置参数如下表:
| Name | Type | Description | Default |
|---|---|---|---|
| header | String | 表头列文本 | |
| field | String | 单元格值字段 | |
| name | String | 列标识名称 | |
| width | Number | 列宽度 | |
| headerAlign | String | 表头列文本位置。left/center/right。 | left |
| align | String | 单元格文本位置。left/center/right。 | left |
| headerCls | String | 表头列样式类。 | |
| cellCls | String | 单元格样式类 | |
| headerStyle | String | 表头列样式 | |
| cellStyle | String | 单元格样式 | |
| editor | Object | 单元格编辑器。 | |
| renderer | Function | 单元格绘制处理函数,同drawcell事件。 | |
| allowMove | Boolean | 是否可移动表头列。 | true |
| allowResize | Boolean | 是否拖拽调节表头列宽度。 | true |
使用HTML配置方式,代码如下
<div id="datagrid1" class="nui-datagrid" style="width:700px;height:280px;" url="org.gocom.components.nui.demo.newdataset.impl.TEmployee.queryEmployee.biz.ext" dataField ="data" >

<div property="columns"> <div type="indexcolumn" ></div>

<div field="loginname" width="120" headerAlign="center" allowSort="true">员工帐号</div>

<div field="name" width="120" headerAlign="center" allowSort="true">姓名</div>

<div field="gender" width="100" renderer="onGenderRenderer" align="center" headerAlign="center">性别</div>

<div field="salary" width="100" allowSort="true">薪资</div>

<div field="age" width="100" allowSort="true">年龄</div>

<div field="createtime" width="100" headerAlign="center" dateFormat="yyyy-MM-dd" allowSort="true">创建日期</div>

</div>

</div>
我们也可以使用Javascript方式,代码如下:
var grid = new nui.DataGrid();
grid.set({
    url: "org.gocom.components.nui.demo.newdataset.impl.TEmployee.queryEmployee.biz.ext",
    style: "width:700px;height:280px;",
    columns: [
        { type: "indexcolumn" },
        { header: "员工帐号", field: "loginname", width: 120, headerAlign: "center", allowSort: true },
        { header: "姓名", field: "name", width: 120, headerAlign: "center", allowSort: true },
        { header: "性别", field: "gender", width: 100, align: "center", renderer: onGenderRenderer },
        { header: "薪资", field: "salary", width: 100, allowSort: true },
        { header: "年龄", field: "age", width: 100, allowSort: true },
        { header: "创建日期", field: "createtime", width: 100, headerAlign: "center", allowSort: true, dateFormat: "yyyy-MM-dd" }
    ]
});
grid.render(document.body);
Note:无论是使用Javascript还是HTML的方式创建表格,实现功能都是一样的。
# 表格:自定义单元格
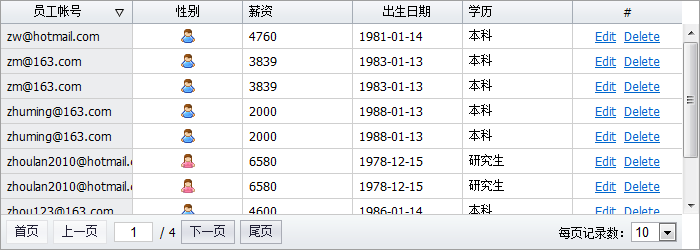
监听处理”drawcell”事件
使用”drawcell”事件,可以自定义单元格内容、样式、行样式等。
grid.on("drawcell", function (e) {
var record = e.record,
column = e.column,
field = e.field,
value = e.value;
//格式化日期 if (field == "birthday") {
if (nui.isDate(value)) e.cellHtml = nui.formatDate(value, "yyyy-MM-dd");
}
//给年龄,增加"岁"字符串 if (field == "age") {
e.cellHtml = value + "岁";
}
//给帐号列,增加背景色 if (field == "loginname") {
e.cellStyle = "background:#ecedef";
}
//超过1万工资,红色标识 if (field == "salary" && value >= 10000) {
e.cellStyle = "color:red;font-weight:bold;";
}
//显示学历 if (field == "educational") {
for (var i = 0, l = Educationals.length; i < l; i++) {
var edu = Educationals[i];
if (edu.id == value) {
e.cellHtml = edu.name;
break;
}
}
}
//action列,超连接操作按钮 if (column.name == "action") {
e.cellStyle = "text-align:center";
e.cellHtml = '<a href="javascript:edit(\'' + record.id + '\')">Edit</a> ' + '<a href="javascript:del(\'' + record.id + '\')">Delete</a>' }
//将性别文本替换成图片 if (column.field == "gender") {
if (e.value == 1) {
e.cellHtml = "<span class='icon-female'></span>" } else {
e.cellHtml = "<span class='icon-boy'></span>" }
}
//设置行样式 if (record.gender == 1) {
e.rowCls = "myrow";
}
});
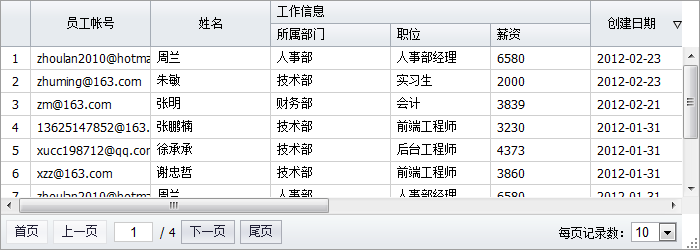
# 表格:多表头

通过给”column”对象设置下一级”columns”列集合对象,轻松实现任意层级的多表头。如下代码:
<div id="datagrid1" class="nui-datagrid" style="width:700px;height:280px;" url="org.gocom.components.nui.demo.newdataset.impl.TEmployee.queryEmployee.biz.ext" dataField ="data" >

<div property="columns">

<div type="indexcolumn"></div>

<div field="loginname" width="120" headerAlign="center" allowSort="true">员工帐号</div>

<div field="name" width="120" headerAlign="center" allowSort="true">姓名</div>

<div header="工作信息" headerAlign="center"> <!--下一级columns--> <div property="columns">

<div width="120" headerAlign="center">部门&职务 <!--下一级columns--> <div property="columns">

<div field="dept_name" width="120">所属部门</div> <div field="position_name" width="100">职位</div>

</div> </div>

<div field="salary" width="100" allowSort="true">薪资</div>

</div> </div>

</div>

</div>
# 表格:锁定列

通过设置表格的frozenStartColumn和frozenEndColumn属性,可以锁定住表格列:
grid.setFrozenStartColumn(0);
grid.setFrozenEndColumn(1);
# 表格:显示/隐藏列
通过设置表格的showColumn和hideColumn方法,可以显示、隐藏表格列。
给列对象设置一个name:
<div name="loginnameColumn" field="loginname" width="120" headerAlign="center" allowSort="true">员工帐号</div>
在运行时调用方法显示和隐藏列:
//显示列 grid.showColumn("loginnameColumn");
//隐藏列 grid.hideColumn("loginnameColumn");
# 表格:过滤行
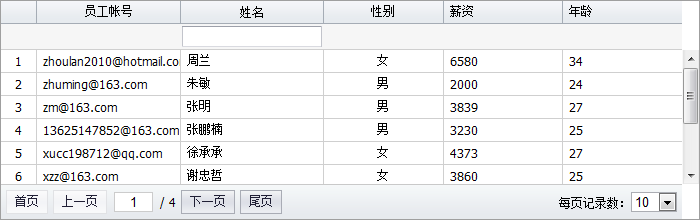
一:定义过滤器
设置表格”showFilter”属性为”true”后,可以在列配置对象上定义过滤器对象:
<div field="name" width="120" headerAlign="center" allowSort="true">姓名
    <!--定义此列的过滤器对象,注意property="filter"--> <input id="nameFilter" property="filter" class="nui-textbox" onvaluechanged="onNameFilterChanged" style="width:100%;" /> </div>
二:处理”valuechanged”事件
在”onvaluechanged”值变化时,会自动调用一个过滤方法onNameFilterChanged。此方法由开发者实现,如下:
function onNameFilterChanged(e) {
    var textbox = e.sender;
    var key = textbox.getValue();

    grid.load({ key: key });
}
# 表格:汇总行
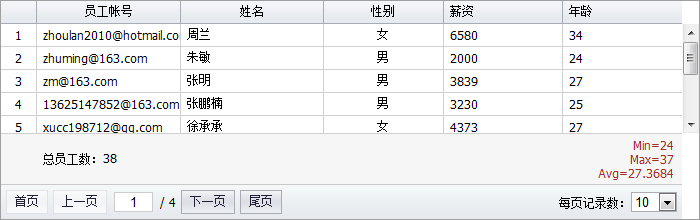
Javascript处理
通常在表格的”load”数据加载完成事件中,更新表格的汇总信息:
grid.on("load", onGridLoad);

function onGridLoad(e) {
    var result = e.result;
    var grid = e.sender;

    var cellEl = grid.getSummaryCellEl("ageColumn");
    cellEl.style.cssText = "text-align:right";
    cellEl.innerHTML = "<span style='color:Brown;'>" + 'Min=' + result.minAge + "<br/>" + 'Max=' + result.maxAge + "<br/>" + 'Avg=' + result.avgAge + "<br/>" + "</span>";

    var cellEl = grid.getSummaryCellEl("totalColumn");
    cellEl.innerHTML = "总员工数:" + result.total;
}
服务端数据处理
在服务端返回表格分页数据时,我们额外增加了一些属性,比如minAge、maxAge、avgAge等,代码如下:
public Hashtable SearchEmployees(string key, int index, int size, string sortField, string sortOrder)
{
    ArrayList employees = ......;   //分页后的数据 int totalCount = ......;        //总记录数 Hashtable result = new Hashtable();
    result["data"] = employees;
    result["total"] = totalCount;

    //生成一些汇总信息 ArrayList ages = DBUtil.Select("select min(age) as minAge, max(age) as maxAge, avg(age) as avgAge from t_employee");
    Hashtable ageInfo = ages[0] as Hashtable;
    result["minAge"] = ageInfo["minAge"];
    result["maxAge"] = ageInfo["maxAge"];
    result["avgAge"] = ageInfo["avgAge"];

    return result;
}
# 详细行
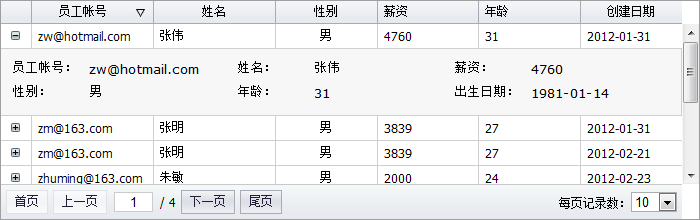
表格的”showRowDetail”方法可以为一个普通表格行增加了一个详细行。
通过”getRowDetailCellEl”方法获得此详细行的DOM元素后,可以在此详细行DOM元素内加入任何HTML内容。
function onShowRowDetail(e) {
    var grid = e.sender;
    var row = e.record;

    var td = grid.getRowDetailCellEl(row);

    nui.ajax({
        url: "org.gocom.components.nui.demo.newdataset.impl.TEmployee.getEmployee.biz.ext" ,
        success: function (text) {
            var o = nui.decode(text);
            //生成详细信息html if (o.gender == 1) o.gender_name = "男";
            else if (o.gender == 2) o.gender_name = "女";
            else o.gender_name = "";

            o.birtyday_name = o.birthday ? nui.formatDate(o.birthday, "yyyy-MM-dd") : "";

            td.innerHTML = "";
            $("#formTemplate").tmpl(o).appendTo(td); ;
        }
    });
}
# 单元格编辑验证
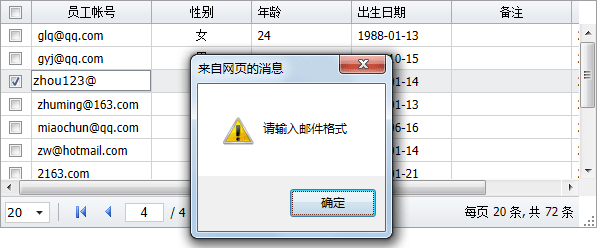
一:设置编辑器验证规则
<div field="loginname" width="120" headerAlign="center" allowSort="true">员工帐号
    <input property="editor" class="nui-textbox" style="width:100%;" required="true" vtype="email" /> </div>
使用编辑器的vtype和onvalidation事件,可以实现编辑器验证规则。详细可以查看:数据验证。
二:监听处理cellcommitedit事件
//提交单元格编辑数据前激发 function onCellCommitEdit(e) {
    var editor = e.editor;
    editor.validate();
    if (editor.isValid() == false) {
        alert(editor.getErrorText());
        e.cancel = true;
    }
}
grid.on("cellcommitedit", onCellCommitEdit);
Grid的cellcommitedit事件,在编辑值提交前激发。此时,可以调用编辑器的验证方法validate,判断输入的内容是否符合验证规则。
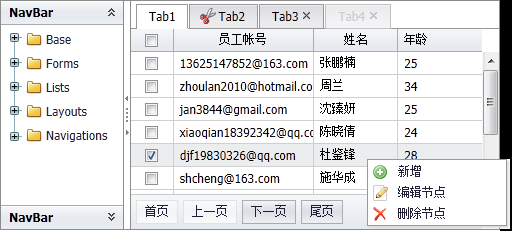
# 表格:右键菜单
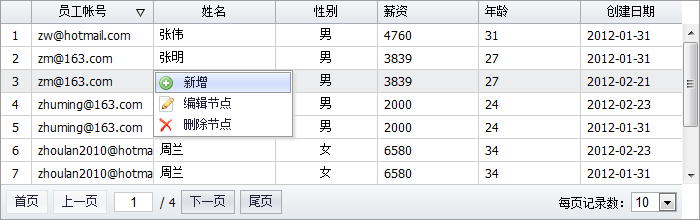
一:创建ContextMenu
<ul id="gridMenu" class="nui-contextmenu" onbeforeopen="onBeforeOpen">

<li name="add" iconCls="icon-add" onclick="onAdd">新增</li>

<li name="edit" iconCls="icon-edit" onclick="onEdit">编辑节点</li>

<li name="remove" iconCls="icon-remove" onclick="onRemove">删除节点</li>

</ul>
二:设置表格contextmenu
<div id="datagrid1" class="nui-datagrid" contextMenu="#gridMenu" > ......
</div>
三:监听beforeopen事件
监听右键菜单的beforeopen事件,可以对右键菜单精确控制。
function onBeforeOpen(e) {
    var grid = nui.get("datagrid1");
    var menu = e.sender;

    var row = grid.getSelected();
    var rowIndex = grid.indexOf(row);
    if (!row ||  rowIndex== 0) {
        e.cancel = true;
        //阻止浏览器默认右键菜单 e.htmlEvent.preventDefault();
        return;
    }
    //////////////////////////////// var editItem = nui.getbyName("edit", menu);
    var removeItem = nui.getbyName("remove", menu);
    editItem.show();
    removeItem.enable();

    if (rowIndex == 1) {
        editItem.hide();
    }
    if (rowIndex == 1) {
        removeItem.disable();
    }

}
四:表头菜单headerContextMenu
创建同样一个menu菜单对象,设置给表格的headerContextMenu属性即可。
# 表格:分组
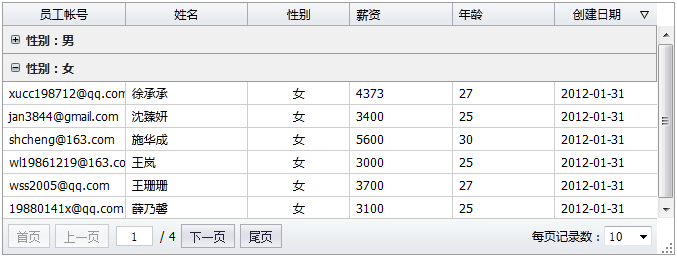
调用分组方法:groupBy。如下代码:
grid.groupBy("gender", "asc");
# 表格:合并单元格
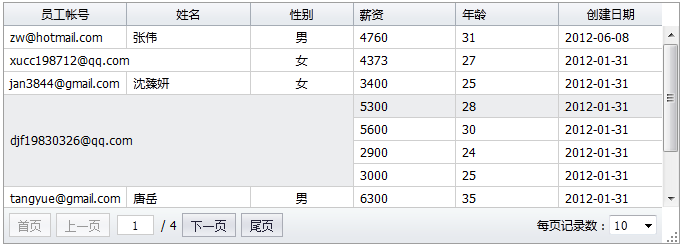
调用方法:margeCells。如下代码:
grid.on("load", onLoad);
function onLoad(e) {
    var grid = e.sender;

    var marges = [
        { rowIndex: 1, columnIndex: 0, rowSpan: 1, colSpan: 2 },
        { rowIndex: 3, columnIndex: 0, rowSpan: 4, colSpan: 3 }
    ];

    grid.margeCells(marges);
}
# 树形控件
# 创建树:树形结构

创建Tree
<ul id="tree1" class="nui-tree" url="../data/tree.txt" style="width:300px;padding:5px;" dataField="trees" showTreeIcon="true" textField="text" idField="id" > </ul>
数据结构:树形
通过url返回的数据结构如下:
{trees:
[
    {id: "base", text: "Base", expanded: false,
        children: [
            {id: "ajax", text: "Ajax"},
            {id: "json", text: "JSON"},
            {id: "date", text: "Date"},
            {id: "control", text: "Control"},
            {id: "messagebox", text: "MessageBox"},
            {id: "window", text: "Window"}
        ]
    },
    ...
]
}
# 创建树:列表结构
创建Tree
<ul id="tree1" class="nui-tree" url="../data/listTree.txt" style="width:200px;padding:5px;" showTreeIcon="true" textField="text" dataField="treeNodes" idField="id" parentField="pid" resultAsTree="false" > </ul>
注意:idField、parentField、resultAsTree属性。
数据结构:列表
通过url返回的数据结构如下:
{treeNodes:
[
    {id: "base", text: "Base", expanded: false},
    {id: "ajax", text: "Ajax", pid: "base"},
    {id: "json", text: "JSON", pid: "base"},
    ......
]
}
其中,id和pid对应父子关系。
# 创建树:本地JSON
创建Tree
没有设置url。
<ul id="tree3" class="nui-tree" style="width:300px;padding:5px;" showTreeIcon="true" textField="text" idField="id" > </ul>
Javascript设置数据
var tree3 = nui.get("tree3");
tree3.loadData([
    { id: "lists", text: "Lists", expanded: false,
        children: [
            { id: "datagrid", text: "DataGrid" },
            { id: "tree", text: "Tree" },
            { id: "treegrid", text: "TreeGrid " }
        ]
            },
    { id: "layouts", text: "Layouts", expanded: false,
        children: [
            { id: "panel", text: "Panel" },
            { id: "splitter", text: "Splitter" },
            { id: "layout", text: "Layout " }
        ]
    },
    { id: "navigations", text: "Navigations", expanded: false,
        children: [
            { id: "pager", text: "Pager" },
            { id: "tabs", text: "Tabs" },
            { id: "navbar", text: "NavBar" },
            { id: "menu", text: "Menu" }
        ]
    }
]);
# 创建树:Html生成
Html标签创建节点
<ul id="tree2" class="nui-tree" style="width:200px;padding:5px;" showTreeIcon="true"> <li> <span>NUI</span> <ul> <li> <span expanded="false">Form</span> <ul> <li>ComboBox</li> <li>DatePicker</li> <li>Spinner</li> <li>TreeSelect</li> </ul> </li> <li> <span expanded="false">Lists</span> <ul> <li><a href="../datagrid/datagrid.html" target="_blank" style="color:Blue;text-decoration:underline;">DataGrid</a></li> <li>Tree</li> </ul> </li> <li> <span expanded="false">Layouts</span> <ul> <li>Panel</li> <li>Splitter</li> <li>Layout</li> </ul> </li> <li> <span expanded="false">Navigations</span> <ul> <li>Tabs</li> <li>NavBar</li> <li>Menu</li> <li>Pager</li> </ul> </li> </ul> </li> </ul>
# 懒加载树

创建代码
<ul id="tree1" class="nui-tree" url="../data/TreeService.jsp?method=LoadNodes" style="width:300px;height:200px;padding:5px;" showTreeIcon="true" textField="name" idField="id" onbeforeload="onBeforeTreeLoad" >

</ul>
服务端返回数据
[{
    id: "form",
    text: "Form",
    ......
    isLeaf: false,                            //是否叶子节点:+和-号
    expanded: false                            //节点处于收缩状态
},
......
]
其中,isLeft 说明此节点是否有下一级节点。expanded 表示此节点处于折叠状态。
懒加载事件
当用户点击”+”图标时,会自动加载下一级节点,此时会把当前节点id传递到后台,也可以拦截加载事件,增加额外属性:
function onBeforeTreeLoad(e) {
    var tree = e.sender;    //树控件 var node = e.node;      //当前节点 var params = e.params;  //参数对象 //可以传递自定义的属性 params.myField = "123"; //后台:request对象获取"myField" }
服务端处理
服务端通过request获取”id”属性后,加载此节点的下一级节点数组,并通过JSON返回。
String id = Request["id"];
if (String.IsNullOrEmpty(id)) id = "-1";

//获取下一级节点 String sql = "select * from plus_file where pid = '" + id + "' order by updatedate";
ArrayList folders = DBUtil.Select(sql);

//判断节点,是否有子节点。如果有,则处理isLeaf和expanded。 for (int i = 0, l = folders.Count; i < l; i++)
{
    Hashtable node = (Hashtable)folders[i];
    String nodeId = node["id"].ToString();

    String sql2 = "select * from plus_file where pid = '" + nodeId + "' order by updatedate";
    ArrayList nodes = DBUtil.Select(sql2);

    if (nodes.Count > 0)
    {
        node["isLeaf"] = false;
        node["expanded"] = false;
    }

}

//返回JSON String json = PluSoft.Utils.JSON.Encode(folders);
Response.Write(json);
# 树操作:增加、删除、修改、移动
增加节点
var tree = nui.get("tree1");
var node = tree.getSelectedNode();
var newNode = {};
tree.addNode(newNode, "before", node);
删除节点
var node = tree.getSelectedNode();
tree.removeNode(node);
编辑节点
var node = tree.getSelectedNode();
tree.beginEdit(node);
移动节点
tree.moveNode(node, targetNode, "before");
# 多选树:CheckBoxTree

创建代码
<ul id="tree2" class="nui-tree" url="../data/tree.txt" style="width:300px;" showTreeIcon="true" textField="text" idField="id" showCheckBox="true" onbeforenodecheck="onBeforeNodeCheck" checkRecursive="true" allowSelect="false" enableHotTrack="false" > </ul>
- showCheckBox:显示树形的checkbox
- checkRecursive:决定是否联动选择
设置多选
tree.setValue("forms,button,lists");
获取多选
var value = tree.getValue();
alert(value);
# 节点拖拽投放

创建代码
<ul id="tree1" class="nui-tree" url="../data/tree.txt" style="width:200px;padding:5px;" showTreeIcon="true" textField="text" idField="id" allowDrag="true" allowDrop="true" > </ul>
- allowDrag:允许拖拽节点
- allowDrop:允许投放节点
# 自定义节点

创建代码
<ul id="tree1" class="nui-tree" url="../data/tree.txt" style="width:200px;padding:5px;" showTreeIcon="true" textField="text" idField="id" ondrawnode="onDrawNode" showCheckBox="true" >

</ul>
此时,我们监听了“drawnode”事件。 drawnode 事件
function onDrawNode(e) {
    var tree = e.sender;
    var node = e.node;

    var hasChildren = tree.hasChildren(node);

    //所有子节点加上超链接 if (hasChildren == false) {
        e.nodeHtml = '<a href="www.primeton.com/api/' + node.id + '.html" target="_blank">' + node.text + '</a>';
    }

    //父节点高亮显示;子节点斜线、蓝色、下划线显示 if (hasChildren == true) {
        e.nodeStyle = 'font-weight:bold;';
    } else {
        e.nodeStyle = "font-style:italic;"; //nodeStyle e.nodeCls = "blueColor";            //nodeCls }

    //修改默认的父子节点图标 if (hasChildren == true) {
        e.iconCls = "folder";
    } else {
        e.iconCls = "file";
    }

    //父节点的CheckBox全部隐藏 if (hasChildren == true) {
        e.showCheckBox = false;
    }
}
Note:
- 文本内容(nodeHtml):所有子节点加上超链接
- 节点样式(nodeStyle/nodeCls):父节点高亮显示;子节点斜线、蓝色、下划线显示
- 节点图片(iconCls):修改默认的父子节点图标
- 隐藏CheckBox(showCheckBox):父节点的CheckBox全部隐藏
- 开发者可以扩展节点判断条件,对文本、样式、图标、CheckBox等做任意自定义。
# 树右键菜单

一:创建ContextMenu
<ul id="treeMenu" class="nui-contextmenu" onbeforeopen="onBeforeOpen">

<li iconCls="icon-move" onclick="onMoveNode">移动节点</li> <li class="separator"></li>

<li> <span iconCls="icon-add">新增节点</span> <ul> <li onclick="onAddBefore">插入节点前</li>

<li onclick="onAddAfter">插入节点后</li> <li onclick="onAddNode">插入子节点</li>

</ul> </li>

<li name="edit" iconCls="icon-edit" onclick="onEditNode">编辑节点</li>

<li name="remove" iconCls="icon-remove" onclick="onRemoveNode">删除节点</li>

</ul>
二:设置contextmenu
<ul id="tree1" class="nui-tree" url="../data/tree.txt" style="width:200px;padding:5px;" showTreeIcon="true" textField="text" idField="id" contextMenu="#treeMenu" > </ul>
三:监听beforeopen事件
function onBeforeOpen(e) {
    var menu = e.sender;
    var tree = nui.get("tree1");

    var node = tree.getSelectedNode();
    if (!node) {
        e.cancel = true;
    }
    if (node && node.text == "Base") {
        e.cancel = true;
        //阻止浏览器默认右键菜单 e.htmlEvent.preventDefault();
        return;
    }

    //////////////////////////////// var editItem = nui.getbyName("edit", menu);
    var removeItem = nui.getbyName("remove", menu);
    editItem.show();
    removeItem.enable();

    if (node.id == "forms") {
        editItem.hide();
    }
    if (node.id == "lists") {
        removeItem.disable();
    }
}
# 过滤树

filter节点过滤
tree.filter(function (node) {
    var text = node.text ? node.text.toLowerCase() : "";
    if (text.indexOf(key) != -1) {
        return true;
    }
});
clearFilter取消过滤
tree.clearFilter();
# TreeGrid
# TreeGrid
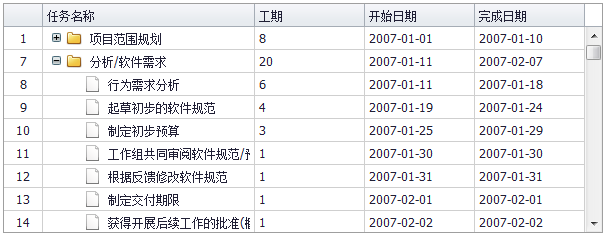
创建TreeGrid
<div id="treegrid1" class="nui-treegrid" style="width:600px;height:280px;" url="../data/tasks.txt" showTreeIcon="true" treeColumn="taskname" dataField="tasks" idField="UID" parentField="ParentTaskUID" resultAsTree="false" >

<div property="columns">

<div type="indexcolumn"></div>

<div name="taskname" field="Name" width="200">任务名称</div>

<div field="Duration" width="100">工期</div>

<div field="Start" width="100" dateFormat="yyyy-MM-dd">开始日期</div>

<div field="Finish" width="100" dateFormat="yyyy-MM-dd">完成日期</div>

</div>

</div>
注意:idField、parentField、resultAsTree属性。
数据结构:列表
通过url返回的数据结构如下:
[
    {id: "base", text: "Base", expanded: false},
    {id: "ajax", text: "Ajax", pid: "base"},
    {id: "json", text: "JSON", pid: "base"},
    ......
]
其中,id和pid对应父子关系。
Columns列配置
TreeGrid的列配置,跟DataGrid类似。参考如下:
| Name | Type | Description | Default |
|---|---|---|---|
| header | String | 表头列文本 | |
| field | String | 单元格值字段 | |
| name | String | 列标识名称 | |
| width | Number | 列宽度 | |
| headerAlign | String | 表头列文本位置。left/center/right。 | left |
| align | String | 单元格文本位置。left/center/right。 | left |
| headerCls | String | 表头列样式类。 | |
| cellCls | String | 单元格样式类 | |
| headerStyle | String | 表头列样式 | |
| cellStyle | String | 单元格样式 | |
| editor | Object | 单元格编辑器。 | |
| renderer | Function | 单元格绘制处理函数,同drawcell事件。 | |
| allowMove | Boolean | 是否可移动表头列。 | true |
| allowResize | Boolean | 是否拖拽调节表头列宽度。 | true |
# TreeGrid:懒加载
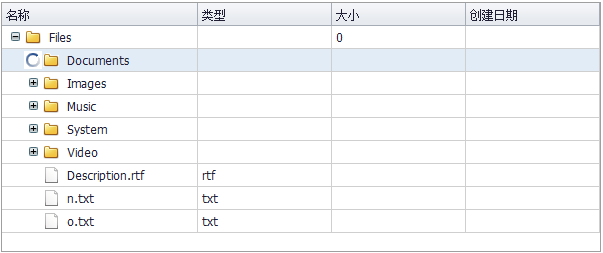
创建代码
<div id="treegrid1" class="nui-treegrid" style="width:600px;height:250px;" url="org.gocom.components.nui.demo.ntree.lazytree.biz.ext" showTreeIcon="true" textField="text" idField="id" dataField="plusFiles" treeColumn="filename" onbeforeload="onBeforeTreeLoad" >

<div property="columns">

<div name="filename" field="name" width="150">名称</div>

<div field="type" width="100">类型</div>

<div field="size" width="100" dateFormat="yyyy-MM-dd">大小</div>

<div field="createdate" width="100" dateFormat="yyyy-MM-dd">创建日期</div>

</div>

</div>
服务端返回数据
{plusFiles:
[{
    id: "form",
    text: "Form",
    ......
    isLeaf: false,                            //是否叶子节点:+和-号
    expanded: false                            //节点处于收缩状态
},
......
]
}
其中,isLeft 说明此节点是否有下一级节点。expanded 表示此节点处于折叠状态。
懒加载事件
当用户点击”+”图标时,会自动加载下一级节点,此时会把当前节点id传递到后台,也可以拦截加载事件,增加额外属性:
function onBeforeTreeLoad(e) { var tree = e.sender; //树控件

 var node = e.node;//当前节点

 var params = e.params; //参数对象 //可以传递自定义的属性

 params.myField = "123"; //后台:request对象获取"myField"

}
服务端处理
服务端通过request获取”id”属性后,加载此节点的下一级节点数组,并通过JSON返回。
String id = Request["id"];
if (String.IsNullOrEmpty(id)) id = "-1";

//获取下一级节点 String sql = "select * from plus_file where pid = '" + id + "' order by updatedate";
ArrayList folders = DBUtil.Select(sql);

//判断节点,是否有子节点。如果有,则处理isLeaf和expanded。 for (int i = 0, l = folders.Count; i < l; i++)
{
    Hashtable node = (Hashtable)folders[i];
    String nodeId = node["id"].ToString();

    String sql2 = "select * from plus_file where pid = '" + nodeId + "' order by updatedate";
    ArrayList nodes = DBUtil.Select(sql2);

    if (nodes.Count > 0)
    {
        node["isLeaf"] = false;
        node["expanded"] = false;
    }
}
//返回JSON String json = PluSoft.Utils.JSON.Encode(folders);
Response.Write(json);
# TreeGrid:自定义单元格
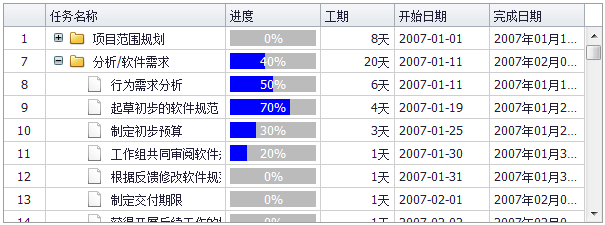
监听处理”drawcell”事件
使用”drawcell”事件,可以自定义单元格内容、样式、行样式等。
function onDrawCell(e){
    var node = e.node,
        column = e.column,
        field = e.field,
        value = e.value;

    //格式化日期 if (field == "Finish") {
        if (nui.isDate(value)) e.cellHtml = nui.formatDate(value, "yyyy年MM月dd日");
    }
    //工期 if (field == "Duration") {
        e.cellHtml = value + "天";
    }
    //进度 if (field == "PercentComplete") {
        e.cellHtml = '<div class="progressbar">' + '<div class="progressbar-percent" style="width:' + value + '%;"></div>' + '<div class="progressbar-label">' + value + '%</div>' +'</div>';
    }
};
# TreeGrid:节点拖拽
创建代码
<div id="treegrid1" class="nui-treegrid" style="width:600px;height:280px;" url="../data/tasks.txt" showTreeIcon="true" treeColumn="taskname" idField="UID" parentField="ParentTaskUID" resultAsTree="false" allowDrag="true" allowDrop="true" >

<div property="columns">

<div type="indexcolumn"></div>

<div name="taskname" field="Name" width="200">任务名称</div>

<div field="Duration" width="100">工期</div>

<div field="Start" width="100" dateFormat="yyyy-MM-dd">开始日期</div>

<div field="Finish" width="100" dateFormat="yyyy-MM-dd">完成日期</div>

</div>

</div>
- allowDrag:允许拖拽节点
- allowDrop:允许投放节点
#
# ToolBar:工具栏

创建工具栏
<div class="nui-toolbar"> <a class="nui-button" iconCls="icon-add">增加</a> <a class="nui-button" iconCls="icon-edit">修改</a> <a class="nui-button" iconCls="icon-remove">删除</a> <span class="separator"></span> <a class="nui-button" plain="true">增加</a> <a class="nui-button" plain="true">修改</a> <a class="nui-button" plain="true">删除</a> <span class="separator"></span> <input class="nui-textbox" /> <a class="nui-button" plain="true">查询</a> </div>
复杂工具栏
<div id="toolbar1" class="nui-toolbar" style="padding:2px;"> <table style="width:100%;"> <tr> <td style="width:100%;"> <a class="nui-menubutton" plain="true" menu="#popupMenu">文件</a> <a class="nui-button" iconCls="icon-addfolder" plain="true" enabled="false">增加</a> <a class="nui-button" iconCls="icon-edit" plain="true">修改</a> <a class="nui-button" iconCls="icon-remove" plain="true">删除</a> <span class="separator"></span> <a class="nui-button" iconCls="icon-reload" plain="true">刷新</a> <a class="nui-button" iconCls="icon-download" plain="true">下载</a> </td> <td style="white-space:nowrap;"><label style="font-family:Verdana;">Filter by: </label> <input class="nui-textbox" /> </td> </tr> </table> </div>
# 菜单

创建菜单
<ul id="menu1" class="nui-menubar" style="width:100%;" url="../data/listMenu.txt" dataField="menulists" idField="id" parentField="pid"> </ul>
url数据格式
{menulist:
[
    { id: "1", text: "文件(F)"},
    '-',
    { id: "2", text: "新建", iconCls: "icon-new", pid: "1"},
    { id: "3", text: "文件", pid: "2"},
    { id: "4", text: "文件夹", pid: "2"},
    { id: "5", text: "打开", iconCls: "icon-folderopen", pid: "1"},
    { id: "6", text: "保存", pid: "1"},
    { id: "7", text: "关闭", pid: "1"},

    { id: "8", text: "编辑(E)"},
    { id: "9", text: "剪切", iconCls: "icon-cut", pid: "8"},
    { id: "10", text: "复制", pid: "8"},
    { id: "11", text: "粘贴", pid: "8"},

    { id: "12", text: "查看(V)"},
    { id: "13", text: "帮助(H)", iconCls: "icon-help"}
]
}
# 菜单:Html标签
创建菜单
<ul id="menu2" class="nui-menubar" style="width:100%;"> <li> <span >文件(F)</span> <ul> <li onclick="onItemClick"> <span >新建</span> <ul>

<li iconCls="icon-new" onclick="onItemClick">文件</li>

<li onclick="onItemClick">项目</li>

<li onclick="onItemClick">网站</li> </ul> </li>

<li class="separator"></li>

<li iconCls="icon-cut" onclick="onItemClick">Cut</li>

<li iconCls="icon-add" onclick="onItemClick">Add</li>

<li iconCls="icon-remove" onclick="onItemClick">Close</li> </ul> </li>

<li class="separator"></li>

<li >编辑(E)</li>

<li onclick="onItemClick">查看(V)</li>

<li iconCls="icon-help" onclick="onItemClick">帮助(H)</li> </ul>
# ContextMenu:右键菜单

创建ContextMenu
<ul id="contextMenu" class="nui-contextmenu" > <li> <span >操作</span> <ul>

<li iconCls="icon-new" onclick="onItemClick">新建</li>

<li class="separator"></li>

<li iconCls="icon-add" onclick="onItemClick">增加</li>

<li iconCls="icon-edit" onclick="onItemClick">修改</li>

<li iconCls="icon-remove" onclick="onItemClick">删除</li>

</ul> </li> <li class="separator"></li>

<li iconCls="icon-open" >打开</li>

<li iconCls="icon-remove" >关闭</li> </ul>
Javascript处理
function onItemClick(e) {
    var item = e.sender;
    alert(item.getText());
}

window.onload = function () {
    $("#region1").bind("contextmenu", function (e) {
        var menu = nui.get("contextMenu");
        menu.showAtPos(e.pageX, e.pageY);
        return false;
    });
}
# Tabs:选项卡

创建Tabs
<div id="tabs1" class="nui-tabs" activeIndex="0" style="width:350px;height:200px;"> <div title="Tab1"> 1
    </div> <div title="Tab2" iconCls="icon-cut" > 2
    </div> <div title="Tab3" showCloseButton="true"> 3
    </div> <div title="Tab4" showCloseButton="true" enabled="false"> 4
    </div> </div>
其中,子tab具有如下属性:
| Name | Type | Description | Default |
|---|---|---|---|
| name | String | 面板名称 | |
| title | String | 标题文本 | |
| newLine | Boolean | 是否换行 | false |
| iconCls | String | 标题图标样式类 | |
| iconStyle | String | 标题图标样式 | |
| headerCls | String | 头部样式类 | |
| headerStyle | String | 头部样式 | |
| bodyCls | String | 内容区样式类 | |
| bodyStyle | String | 内容区样式 | |
| visible | Boolean | 是否显示 | true |
| enabled | Boolean | 是否启用 | true |
| showCloseButton | Boolean | 是否显示关闭按钮 | true |
| url | String | 路径地址 | |
| onload | Function | 加载成功时激发 | |
| ondestroy | Function | 销毁时激发 | |
| removeAction | String | tab的IFrame销毁时的动作,比如”close”,”cancel”,”ok”。 |
# Tabs:懒加载页面

创建Tabs
<ul id="tree1" class="nui-tree" url="../data/tree.txt" style="width:300px;padding:5px;" showTreeIcon="true" textField="text" dataField="trees" idField="id" > </ul>
数据结构
通过url返回的数据结构如下:
{trees:
[
    {title: "Tab1", url: "../tabs/pages/page1.html", refreshOnClick: true},
    {title: "Tab2", url: "../tabs/pages/page2.html", showCloseButton: true},
    {title: "Tab3", url: "../tabs/pages/page3.html"},
    {title: "Tab4", url: "../tabs/pages/page4.html"},
    {title: "Tab5", url: "../tabs/pages/page5.html"}
]
}
# OutlookBar:折叠面板组

创建OutlookBar
<div id="outlookbar1" class="nui-outlookbar " activeIndex="0" style="width:180px;height:250px;" autoCollapse="true"> <div title="权限管理"> 1
    </div> <div title="用户管理"> 2
    </div> </div>
# OutlookMenu:折叠菜单

创建OutlookMenu
<div class="nui-outlookmenu" url="../data/outlookmenu.txt" onitemselect="onItemSelect" dataField="outlookmenus" idField="id" parentField="pid" textField="text" > </div>
数据结构
{outlookmenus:
[
    { id: "user", text: "用户管理"},
    { id: "addUser", pid: "user", text: "增加用户", iconCls: "icon-add", url: "../navbartree/navbartree.html" },
    { id: "editUser", pid: "user", text: "修改用户", iconCls: "icon-edit", url: "../buttonedit/openwindow.html" },
    { id: "removeUser", pid: "user", text: "删除用户", iconCls: "icon-remove", url: "../datagrid/datagrid.html" },

    { id: "right", text: "权限管理"},
    { id: "addRight", pid: "right", text: "查询权限", iconCls: "Note", url: "../navbartree/navbartree.html", iconPosition: "top" },
    { id: "editRight", pid: "right", text: "操作权限", iconCls: "Reports", url: "../buttonedit/openwindow.html", iconPosition: "top" }
]
}
# OutlookTree:折叠树

创建OutlookTree
<div id="leftTree" class="nui-outlooktree" url="../data/outlooktree.txt" onnodeselect="onNodeSelect" dataField="outlooktrees" textField="text" idField="id" parentField="pid" > </div>
数据格式
{outlooktrees:
[
    {id: "user", text: "用户管理"},
    {id: "lists", text: "Lists", pid: "user" },
    {id: "datagrid", text: "DataGrid", pid: "lists"},
    {id: "tree", text: "Tree" , pid: "lists"},
    {id: "treegrid", text: "TreeGrid " , pid: "lists"},
    {id: "layouts", text: "Layouts", expanded: false, pid: "user"},
    {id: "panel", text: "Panel", pid: "layouts"},
    {id: "splitter", text: "Splitter", pid: "layouts"},
    {id: "layout", text: "Layout ", pid: "layouts"},
    { id: "right", text: "权限管理"},
    {id: "base", text: "Base", expanded: false, pid: "right" },
    {id: "ajax", text: "Ajax", pid: "base"},
    {id: "json", text: "JSON", pid: "base"},
    {id: "date", text: "Date", pid: "base"},
    {id: "forms", text: "Forms", expanded: false, pid: "right"},
    {id: "button", text: "Button", pid: "forms"},
    {id: "listbox", text: "ListBox", pid: "forms"},
    {id: "checkboxlist", text: "CheckBoxList", pid: "forms"},
    {id: "radiolist", text: "RadioList", pid: "forms"},
    {id: "calendar", text: "Calendar", pid: "forms"}
]
}
# Pager:分页控件

创建代码
<div class="nui-pager" style="width:600px;background:#ccc;" totalCount="123" onpagechanged="onPageChanged" sizeList="[5,10,20,100]" showTotalCount="true" > </div> <script type="text/javascript"> function onPageChanged(e) {
        alert(e.pageIndex+":"+e.pageSize);
    }
</script>
# 布局控件
# Fit:高度撑满布局
高度撑满
Fit控件的高度为:父元素高度 - 其他同级元素高度。
这样,在Fit控件内放一个datagrid,将datagrid设置高度100%,就等于表格高度撑满了。
# Layout:布局管理器

创建Layout
<div id="layout1" class="nui-layout" style="width:600px;height:400px;" borderStyle="border:solid 1px #aaa;"> <div title="north" region="north" height="80" > north
    </div> <div title="south" region="south" showSplit="false" showHeader="true" height="80" > south
    </div> <div title="west" region="west" width="200" > west
    </div> <div title="east" region="east" showCloseButton="true" > east
    </div> <div title="center" region="center" > center
    </div> </div>
其中,region是面板模块,具有如下属性:
| Name | Type | Description | Default |
|---|---|---|---|
| region | String | 面板名称 | |
| title | String | 标题文本 | |
| iconCls | String | 标题图标样式类 | |
| iconStyle | String | 标题图标样式 | |
| cls | String | 样式类 | |
| style | String | 样式 | |
| headerCls | String | 头部样式类 | |
| headerStyle | String | 头部样式 | |
| bodyCls | String | 内容区样式类 | |
| bodyStyle | String | 内容区样式 | |
| visible | Boolean | 是否显示 | true |
| expanded | Boolean | 是否展开 | true |
| showCollapseButton | Boolean | 是否显示折叠按钮 | true |
| showCloseButton | Boolean | 是否显示关闭按钮 | true |
| showSplit | Boolean | 是否显示分割条 | true |
| showHeader | Boolean | 是否显示头部 | true |
| allowResize | Boolean | 是否允许拖拽调节 | true |
| splitSize | Number | 分隔条尺寸 | 6 |
| width | Number | 宽度 | |
| height | Number | 高度 | |
| minWidth | Number | 最小宽度 | |
| minHeight | Number | 最小高度 | |
| maxWidth | Number | 最大宽度 | |
| maxHeight | Number | 最大高度 |
# Splitter:折叠布局器

横向Splitter
<div class="nui-splitter" style="width:350px;height:200px;"> <div size="30%" showCollapseButton="true"> 1
    </div> <div showCollapseButton="true"> 2
    </div> </div>
竖向Splitter
<div class="nui-splitter" vertical="true" style="width:350px;height:200px;"> <div size="30%" showCollapseButton="true"> 1
    </div> <div showCollapseButton="true"> 2
    </div> </div>
Splitter 面板对象,属性如下:
| Name | Type | Description | Default |
|---|---|---|---|
| minSize | Number | 最小尺寸 | 80 |
| maxSize | Number | 最大尺寸 | 3000 |
| size | Number/String | 尺寸 | |
| showCollapseButton | Boolean | 是否显示折叠图标 | |
| cls | String | 面板样式类 | |
| style | String | 面板样式 | |
| visible | Boolean | 是否显示 | |
| expanded | Boolean | 是否折叠 |
# Panel:标题面板

创建Panel
<div class="nui-panel" title="header" iconCls="icon-add" style="width:300px;height:200px;" showToolbar="true" showCollapseButton="true" showFooter="true" > <!--toolbar--> <div property="toolbar" > <input type='button' value='Toolbar' style='vertical-align:middle;'/> </div> <!--footer--> <div property="footer"> <input type='button' value='Footer' style='vertical-align:middle;'/> </div> <!--body--> body<br /> 1<br />1<br />1<br />1<br />1<br />1<br />1<br />1<br />1<br />1<br />1<br />1<br />1<br />1<br />1<br />1<br /> </div>
Panel分为3个区域:
- toolbar:工具栏区域
- footer:底部区域
- body:内容区域
# Panel:懒加载

创建代码
<div class="nui-panel" title="懒加载页面" style="width:300px;height:150px;" showCollapseButton="true" bodyStyle="padding:0;" url="../tabs/pages/page1.html" expanded="false" > </div>
- expanded:默认折叠面板
- url:展开面板时,加载的页面地址
# Window:弹出面板

创建Window
<div id="win1" class="nui-window" title="Window" style="width:300px;height:200px;" showMaxButton="true" showToolbar="true" showFooter="true" showModal="true" allowResize="true" allowDrag="true" > <div property="toolbar" style="padding:5px;">

<input type='button' value='Toolbar' style='vertical-align:middle;'/> </div>

<div property="footer">

<input type='button' value='Footer' style='vertical-align:middle;'/> </div>

 1<br />1<br />1<br />1<br />1<br />1<br />1<br />1<br />1<br />1<br />1<br />1<br />1<br />1<br />1<br />1<br />

</div>
弹出面板
var win = nui.get("win1");
win.show();
隐藏面板
var win = nui.get("win1");
win.hide();
# FormLayout:表单布局器

单列多行
<table class="form-table" border="0" cellpadding="1" cellspacing="2"> <tr> <td class="form-label" style="width:60px;">姓名:</td> <td style="width:100px"> <input name="name" class="nui-textbox" /> </td> </tr> <tr> <td class="form-label">密码:</td> <td > <input name="pwd" class="nui-password" /> </td> </tr> </table>
多列多行
<table class="form-table" border="0" cellpadding="1" cellspacing="2"> <tr> <td class="form-label" style="width:60px;">姓名:</td> <td style="width:150px"> <input name="name" class="nui-textbox" /> </td> <td class="form-label" style="width:60px;">地址:</td> <td style="width:150px"> <input name="addr" class="nui-textbox" /> </td> </tr> <tr> <td class="form-label">性别:</td> <td > <input name="gender" class="nui-radiobuttonlist" data="[{id: 1, text: '男'}, {id: 2, text: '女'}]"/> </td> <td class="form-label">年龄:</td> <td > <input name="age" class="nui-spinner" /> </td> </tr> <tr> <td class="form-label">备注:</td> <td colspan="3" > <input name="remarks" class="nui-textarea" style="width:343px;height:60px;"/> </td> </tr> </table>
# 图表控件
图表控件是基于Echarts3.0实现的,本文档列举了Echarts的部分属性配置项,若需要查看所有的属性配置项,请参考Echarts官网配置项手册:http://echarts.baidu.com/option.html。
以下图表控件示例默认已经导入了echarts.js、dataTool.js、jquery.js文件。
具体下载地址为:
echarts.js:http://echarts.baidu.com/download.html
dataTool.js:https://github.com/ecomfe/echarts/tree/master/dist/extension
jquery.js:http://echarts.baidu.com/gallery/vendors/jquery/jquery.js
# LineChart:折线图
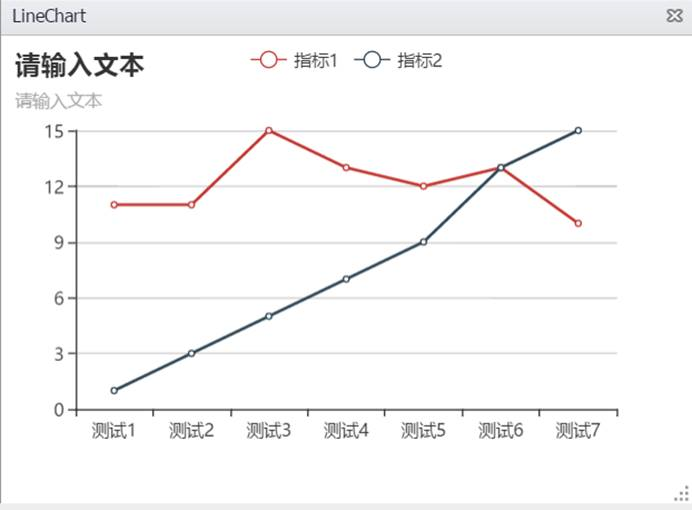
一:初始化 设置图表显示区域大小:
<div id="chartContainer" style=" height:400px;"></div>
调用Echarts内置方法init进行初始化:
var myChart = echarts.init(document.getElementById(chartContainer));
二:配置属性
var option = {
                title : {
                    text: '请输入文本',
                    subtext: '请输入文本'
                },
                tooltip : {
                    trigger: 'axis'
                },
                legend: {
                    data:['指标1','指标2']
                },
                toolbox: {
                    show : false,
                    feature : {
                        mark : {show: true},
                        dataView : {show: true, readOnly: false},
                        magicType : {show: true, type: ['line', 'bar']},
                        restore : {show: true},
                        saveAsImage : {show: true}
                    }
                },
                calculable : true,
                xAxis : [
                    {
                        type : 'category',
                        data : ['测试1','测试2','测试3','测试4','测试5','测试6','测试7']
                    }
                ],
                yAxis : [
                    {
                        type : 'value',
                    }
                ],
                series : [
                    {
                        name:'指标1',
                        type:'line',
                        data:[11, 11, 15, 13, 12, 13, 10],

                    },
                    {
                        name:'指标2',
                        type:'line',
                        data:[1, 3, 5, 7, 9, 13, 15],

                    }
                ]
            };
在option中可以自定义标题、数据、提示框、图例等属性。
其中标题属性title,可以自定义主标题text,和副标题subtext。
触发类型属性trigger,定义触发类型,如axis:坐标轴触发。
系列列表series,每个系列有名称name和数据data属性,且通过type决定图表类型,其中type:'line'表示该图表类型为折线图。
其他属性配置请参考官网配置项手册:http://echarts.baidu.com/option.html。
三:加载配置 最后通过setOption方法加载配置并显示:
myChart.setOption(option);
# BarChart:条形图
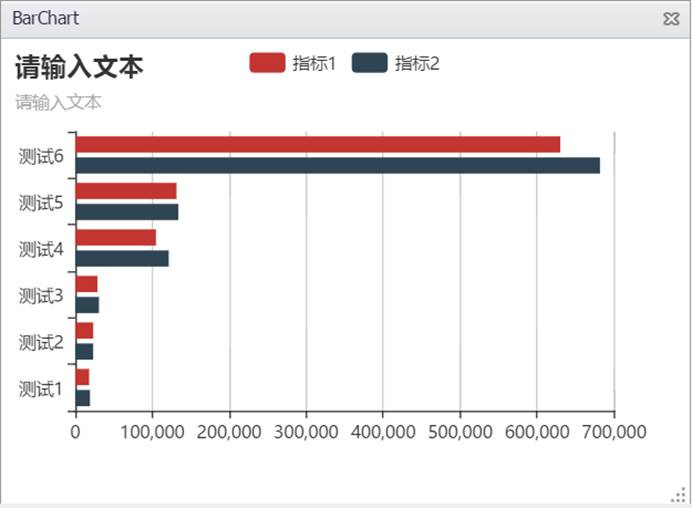
一:初始化 设置图表显示区域大小:
<div id="chartContainer" style=" height:400px;"></div>
调用Echarts内置方法init进行初始化:
var myChart = echarts.init(document.getElementById(chartContainer));
二:配置属性 在option中配置属性:
 var option = {
                title : {
                    text: '请输入文本',
                    subtext: '请输入文本'
                },
                tooltip : {
                    trigger: 'axis'
                },
                legend: {
                    data:['指标1', '指标2']
                },
                toolbox: {
                    show : false,
                    feature : {
                        mark : {show: true},
                        dataView : {show: true, readOnly: false},
                        magicType: {show: true, type: ['line', 'bar']},
                        restore : {show: true},
                        saveAsImage : {show: true}
                    }
                },
                calculable : true,
                xAxis : [
                    {
                        type : 'value',
                        boundaryGap : [0, 0.01]
                    }
                ],
                yAxis : [
                    {
                        type : 'category',
                        data : ['测试1','测试2','测试3','测试4','测试5','测试6']
                    }
                ],
                series : [
                    {
                        name:'指标1',
                        type:'bar',
                        data:[18203, 23489, 29034, 104970, 131744, 630230]
                    },
                    {
                        name:'指标2',
                        type:'bar',
                        data:[19325, 23438, 31000, 121594, 134141, 681807]
                    }
                ]
            };
其中series中type:'bar'表示该图表类型为条形图。
其他属性配置请参考官网配置项手册:http://echarts.baidu.com/option.html。
三:加载配置 最后通过setOption方法加载配置并显示:
myChart.setOption(option);
# ColumnChart:柱状图
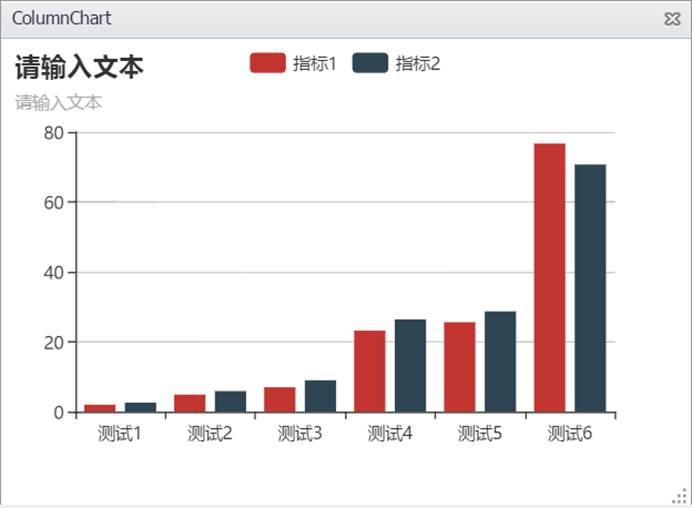
一:初始化 设置图表显示区域大小:
<div id="chartContainer" style=" height:400px;"></div>
调用Echarts内置方法init进行初始化:
var myChart = echarts.init(document.getElementById(chartContainer));
二:配置属性 在option中配置属性:
 var option = {
                    title : {
                        text: '请输入文本',
                        subtext: '请输入文本'
                    },
                    tooltip : {
                        trigger: 'axis'
                    },
                    legend: {
                        data:['指标1','指标2']
                    },
                    toolbox: {
                        show : false,
                        feature : {
                            mark : {show: true},
                            dataView : {show: true, readOnly: false},
                            magicType : {show: true, type: ['line', 'bar']},
                            restore : {show: true},
                            saveAsImage : {show: true}
                        }
                    },
                    calculable : true,
                    xAxis : [
                        {
                            type : 'category',
                            data : ['测试1','测试2','测试3','测试4','测试5','测试6']
                        }
                    ],
                    yAxis : [
                        {
                            type : 'value'
                        }
                    ],
                    series : [
                        {
                            name:'指标1',
                            type:'bar',
                            data:[2.0, 4.9, 7.0, 23.2, 25.6, 76.7],

                        },
                        {
                            name:'指标2',
                            type:'bar',
                            data:[2.6, 5.9, 9.0, 26.4, 28.7, 70.7],

                        }
                    ]
         };
其中工具栏toolbox属性,show可以设置是否显示工具栏组件,saveAsImage可以设置是否显示“保存为图片”组件。
其他属性配置请参考官网配置项手册:http://echarts.baidu.com/option.html。
三:加载配置 最后通过setOption方法加载配置并显示:
myChart.setOption(option);
# PieChart:饼图
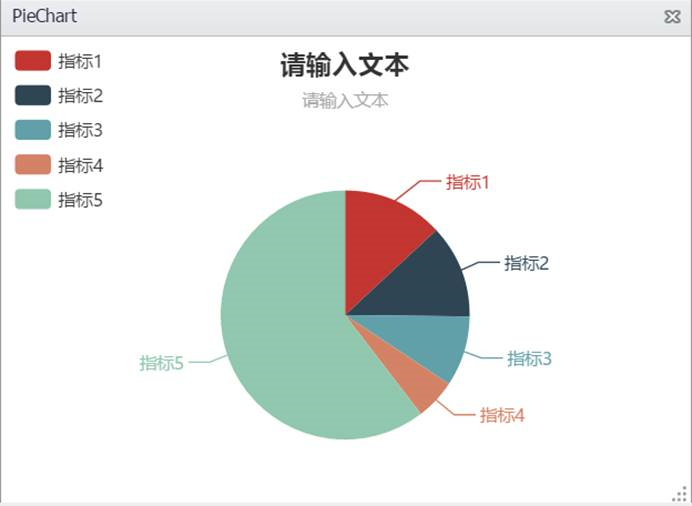
一:初始化 设置图表显示区域大小:
<div id="chartContainer" style=" height:400px;"></div>
调用Echarts内置方法init进行初始化:
var myChart = echarts.init(document.getElementById(chartContainer));
二:配置属性 在option中配置属性:
 var option = {
                title : {
                    text: '请输入文本',
                    subtext: '请输入文本',
                    x:'center'
                },
                tooltip : {
                    trigger: 'item',
                    formatter: "{a} <br/>{b} : {c} ({d}%)"
                },
                legend: {
                    orient : 'vertical',
                    x : 'left',
                    data:['指标1','指标2','指标3','指标4','指标5']
                },
                toolbox: {
                    show : false,
                    feature : {
                        mark : {show: true},
                        dataView : {show: true, readOnly: false},
                        magicType : {
                            show: true,
                            type: ['pie', 'funnel'],
                            option: {
                                funnel: {
                                    x: '25%',
                                    width: '50%',
                                    funnelAlign: 'left',
                                    max: 1548
                                }
                            }
                        },
                        restore : {show: true},
                        saveAsImage : {show: true}
                    }
                },
                calculable : true,
                series : [
                    {
                        name:'标识1',
                        type:'pie',
                        radius : '55%',
                        center: ['50%', '60%'],
                        data:[
                            {value:335, name:'指标1'},
                            {value:310, name:'指标2'},
                            {value:234, name:'指标3'},
                            {value:135, name:'指标4'},
                            {value:1548, name:'指标5'}
                        ]
                    }
                ]
            };
其中series中type:'pie'表示该图表类型为饼图。
其他属性配置请参考官网配置项手册:http://echarts.baidu.com/option.html。
三:加载配置 最后通过setOption方法加载配置并显示:
myChart.setOption(option);
# RadarChart:雷达图
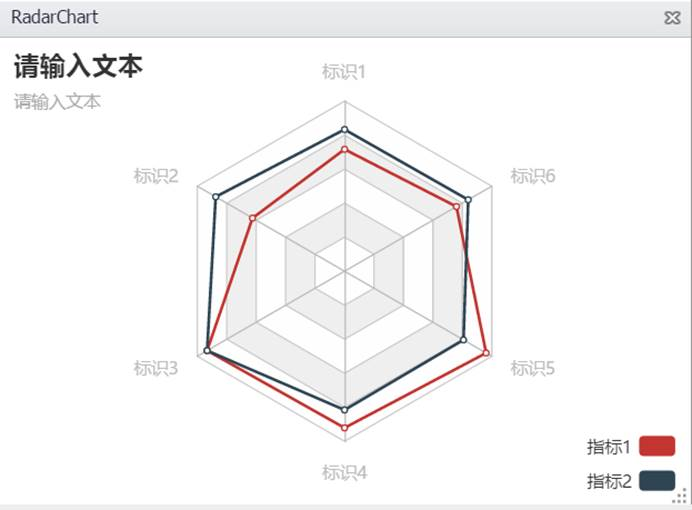
一:初始化 设置图表显示区域大小:
<div id="chartContainer" style=" height:400px;"></div>
调用Echarts内置方法init进行初始化:
var myChart = echarts.init(document.getElementById(chartContainer));
二:配置属性 在option中配置属性:
 var option = {
                title : {
                    text: '请输入文本',
                    subtext: '请输入文本',
                    x:'center'
                },
                tooltip : {
                    trigger: 'item',
                    formatter: "{a} <br/>{b} : {c} ({d}%)"
                },
                legend: {
                    orient : 'vertical',
                    x : 'left',
                    data:['指标1','指标2','指标3','指标4','指标5']
                },
                toolbox: {
                    show : false,
                    feature : {
                        mark : {show: true},
                        dataView : {show: true, readOnly: false},
                        magicType : {
                            show: true,
                            type: ['pie', 'funnel'],
                            option: {
                                funnel: {
                                    x: '25%',
                                    width: '50%',
                                    funnelAlign: 'left',
                                    max: 1548
                                }
                            }
                        },
                        restore : {show: true},
                        saveAsImage : {show: true}
                    }
                },
                calculable : true,
                series : [
                    {
                        name:'标识1',
                        type:'pie',
                        radius : '55%',
                        center: ['50%', '60%'],
                        data:[
                            {value:335, name:'指标1'},
                            {value:310, name:'指标2'},
                            {value:234, name:'指标3'},
                            {value:135, name:'指标4'},
                            {value:1548, name:'指标5'}
                        ]
                    }
                ]
            };
其中属性calculable可以设置是否显示拖拽手柄。
series中type属性type:'pie'表示该图表类型是雷达图。
其他属性配置请参考官网配置项手册:http://echarts.baidu.com/option.html。
三:加载配置 最后通过setOption方法加载配置并显示:
myChart.setOption(option);
# ScatterChart:散点图
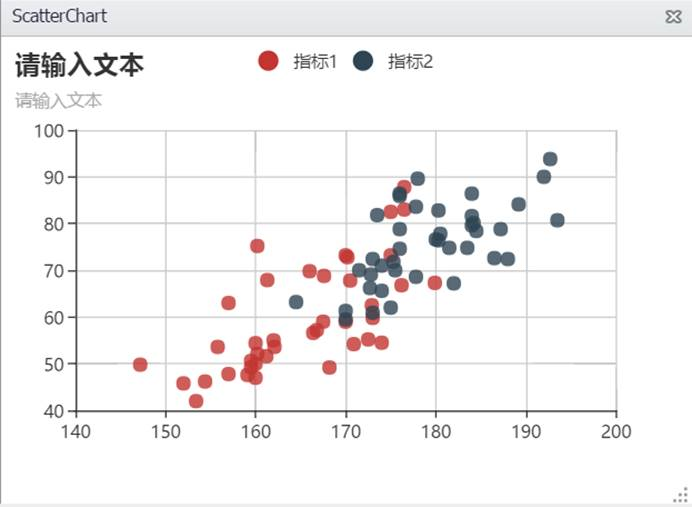
一:初始化 设置图表显示区域大小:
<div id="chartContainer" style=" height:400px;"></div>
调用Echarts内置方法init进行初始化:
var myChart = echarts.init(document.getElementById(chartContainer));
二:配置属性 在option中配置属性:
 var option = {
                title : {
                    text: '请输入文本',
                    subtext: '请输入文本'
                },
                tooltip : {
                    trigger: 'axis',
                    showDelay : 0,
                },
                legend: {
                    data:['指标1','指标2']
                },
                toolbox: {
                    show : false,
                    feature : {
                        mark : {show: true},
                        dataZoom : {show: true},
                        dataView : {show: true, readOnly: false},
                        restore : {show: true},
                        saveAsImage : {show: true}
                    }
                },
                xAxis : [
                    {
                        type : 'value',
                        scale:true
                    }
                ],
                yAxis : [
                    {
                        type : 'value',
                        scale:true
                    }
                ],
                series : [
                    {
                        name:'指标1',
                        type:'scatter',
                        data: [[161.2, 51.6], [167.5, 59.0], [159.5, 49.2], [157.0, 63.0], [155.8, 53.6],
                            [170.0, 59.0], [159.1, 47.6], [166.0, 69.8], [176.2, 66.8], [160.2, 75.2],
                            [172.5, 55.2], [170.9, 54.2], [172.9, 62.5], [153.4, 42.0], [160.0, 50.0],
                            [147.2, 49.8], [168.2, 49.2], [175.0, 73.2], [157.0, 47.8], [167.6, 68.8],
                            [159.5, 50.6], [175.0, 82.5], [166.8, 57.2], [176.5, 87.8], [170.2, 72.8],
                            [174.0, 54.5], [173.0, 59.8], [179.9, 67.3], [170.5, 67.8], [160.0, 47.0],
                            [154.4, 46.2], [162.0, 55.0], [176.5, 83.0], [160.0, 54.4], [152.0, 45.8],
                            [162.1, 53.6], [170.0, 73.2], [160.2, 52.1], [161.3, 67.9], [166.4, 56.6]
                        ]
                    },
                    {
                        name:'指标2',
                        type:'scatter',
                        data: [[174.0, 65.6], [175.3, 71.8], [193.5, 80.7], [186.5, 72.6], [187.2, 78.8],
                            [181.5, 74.8], [184.0, 86.4], [184.5, 78.4], [175.0, 62.0], [184.0, 81.6],
                            [180.0, 76.6], [177.8, 83.6], [192.0, 90.0], [176.0, 74.6], [174.0, 71.0],
                            [184.0, 79.6], [192.7, 93.8], [171.5, 70.0], [173.0, 72.4], [176.0, 85.9],
                            [176.0, 78.8], [180.5, 77.8], [172.7, 66.2], [176.0, 86.4], [173.5, 81.8],
                            [178.0, 89.6], [180.3, 82.8], [180.3, 76.4], [164.5, 63.2], [173.0, 60.9],
                            [183.5, 74.8], [175.5, 70.0], [188.0, 72.4], [189.2, 84.1], [172.8, 69.1],
                            [170.0, 59.5], [182.0, 67.2], [170.0, 61.3], [177.8, 68.6], [184.2, 80.1]
                        ]
                    }
                ]
            };
其中series中type:'scatter'表示该图表类型为散点图,data中的数据为内置数据,如需从外置文件中读取数据,请参考示例11.13和11.15。
其他属性配置请参考官网配置项手册:http://echarts.baidu.com/option.html。
三:加载配置 最后通过setOption方法加载配置并显示:
myChart.setOption(option);
# KlineChart:K线图
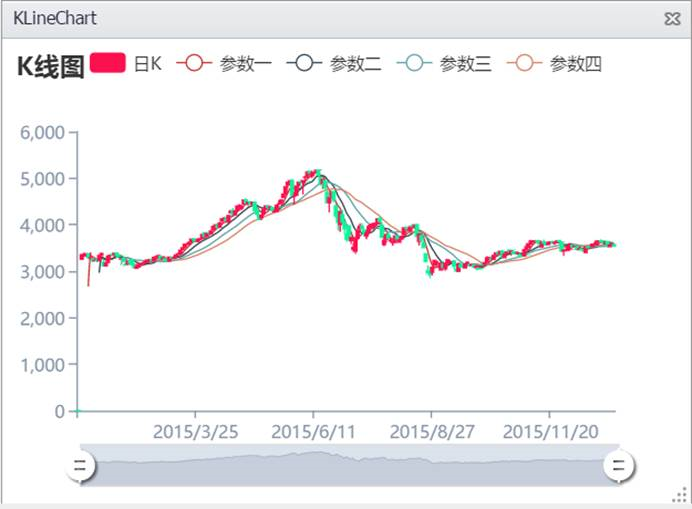
一:初始化 设置图表显示区域大小:
<div id="chartContainer" style=" height:400px;"></div>
调用Echarts内置方法init进行初始化:
var klinechart =echarts.init(document.getElementById(chartContainer));
二: 数据处理 原始数据,用户可以在此基础上扩展和修改数据,以下给出三组示例数据:
 var rawData = [
    ['2015/12/31','3570.47','3539.18','-33.69','-0.94%','3538.35','3580.6','176963664','25403106','-'],

    ['2015/12/30','3566.73','3572.88','9.14','0.26%','3538.11','3573.68','187889600','26778766','-'],

    ['2015/12/29','3528.4','3563.74','29.96','0.85%','3515.52','3564.17','182551920','25093890','-'],

    ['2015/12/28','3635.77','3533.78','-94.13','-2.59%','3533.78','3641.59','269983264','36904280','-']

].reverse();
从原始数据中取出日期:
 var dates = rawData.map(function (item) {
    return item[0];
    });
从原始数据中取出参数一、参数二、参数三、参数四:
 var data = rawData.map(function (item) {
        return [+item[1], +item[2], +item[5], +item[6]];
        });
计算K线指标:
 function calculateMA(dayCount, data) {
    var result = [];
    for (var i = 0, len = data.length; i < len; i++) {
        if (i < dayCount) {
            result.push('-');
            continue;
        }
        var sum = 0;
        for (var j = 0; j < dayCount; j++) {
            sum += data[i - j][1];
        }
        result.push(sum / dayCount);
    }
    return result;
}
三:配置属性 在option中配置属性:
var option = {
title: {
text: 'K线图'
},
legend: {
data: ['日K', '参数一', '参数二','参数三', '参数四'],
inactiveColor: '#777',
},
tooltip: {
trigger: 'axis',
axisPointer: {
animation: false,
lineStyle: {
color: '#376df4',
width: 2,
opacity: 1
}
}
},
xAxis: {
type: 'category',
data: dates,
axisLine: { lineStyle: { color: '#8392A5' } }
},
yAxis: {
scale: true,
axisLine: { lineStyle: { color: '#8392A5' } },
splitLine: { show: false }
},
dataZoom: [{
textStyle: {
color: '#8392A5'
},
handleIcon: 'M10.7,11.9v-1.3H9.3v1.3c-4.9,0.3-8.8,4.4-8.8,9.4c0,5,3.9,9.1,8.8,9.4v1.3h1.3v-1.3c4.9-0.3,8.8-4.4,8.8-9.4C19.5,16.3,15.6,12.2,10.7,11.9z M13.3,24.4H6.7V23h6.6V24.4z M13.3,19.6H6.7v-1.4h6.6V19.6z',
handleSize: '80%',
dataBackground: {
areaStyle: {
color: '#8392A5'
},
lineStyle: {
opacity: 0.8,
color: '#8392A5'
}
},
handleStyle: {
color: '#fff',
shadowBlur: 3,
shadowColor: 'rgba(0, 0, 0, 0.6)',
shadowOffsetX: 2,
shadowOffsetY: 2
}
}, {
type: 'inside'
}],
animation: false,
series: [
{
type: 'candlestick',
name: '日K',
data: data,
itemStyle: {
normal: {
color: '#FD1050',
color0: '#0CF49B',
borderColor: '#FD1050',
borderColor0: '#0CF49B'
}
}
},
{
name: '参数一',
type: 'line',
data: calculateMA(5, data),
smooth: true,
showSymbol: false,
lineStyle: {
normal: {
width: 1
}
}
},
{
name: '参数二',
type: 'line',
data: calculateMA(10, data),
smooth: true,
showSymbol: false,
lineStyle: {
normal: {
width: 1
}
}
},
{
name: '参数三',
type: 'line',
data: calculateMA(20, data),
smooth: true,
showSymbol: false,
lineStyle: {
normal: {
width: 1
}
}
},
{
name: '参数四',
type: 'line',
data: calculateMA(30, data),
smooth: true,
showSymbol: false,
lineStyle: {
normal: {
width: 1
}
}
}
]
};
其中series中type: 'line'表示改图表的基础类型是折线图。
其他属性配置请参考官网配置项手册:http://echarts.baidu.com/option.html。
四:加载配置 最后通过setOption方法加载配置并显示:
klinechart.setOption(option);
# BoxPlotChart:箱线图
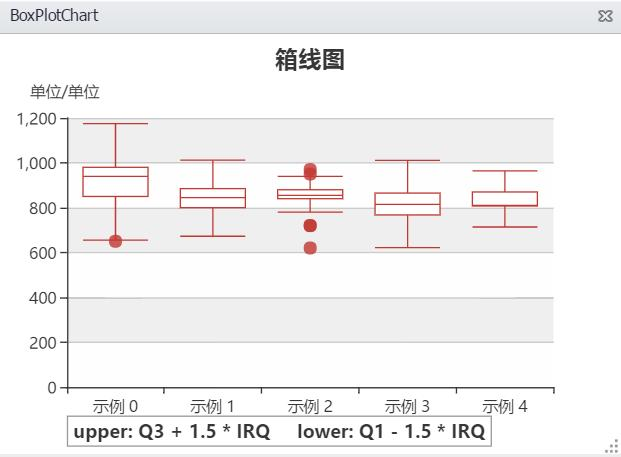
一:初始化 设置图表显示区域大小:
<div id="chartContainer" style=" height:400px;"></div>
调用Echarts内置方法init进行初始化:
var boxplotchart =echarts.init(document.getElementById(chartContainer));
二: 数据处理 对数据进行预处理,返回箱线数据赋值给data:
 var data = echarts.dataTool.prepareBoxplotData([
[850, 740, 900, 1070, 930, 850, 950, 980, 980, 880, 1000, 980, 930, 650, 760, 810, 1000, 1000, 960, 960],
[960, 940, 960, 940, 880, 800, 850, 880, 900, 840, 830, 790, 810, 880, 880, 830, 800, 790, 760, 800],
[880, 880, 880, 860, 720, 720, 620, 860, 970, 950, 880, 910, 850, 870, 840, 840, 850, 840, 840, 840],
[890, 810, 810, 820, 800, 770, 760, 740, 750, 760, 910, 920, 890, 860, 880, 720, 840, 850, 850, 780],
[890, 840, 780, 810, 760, 810, 790, 810, 820, 850, 870, 870, 810, 740, 810, 940, 950, 800, 810, 870]
]);
三:配置属性 在option中配置属性:
 option = {
    title: [
    {
        text: '箱线图',
        left: 'center',
        },
        {
            text: 'upper: Q3 + 1.5 * IRQ \t\t\t lower: Q1 - 1.5 * IRQ',
            borderColor: '#999',
            borderWidth: 1,
            textStyle: {
                fontSize: 14
                },
                left: '10%',
                top: '92%'
            }
            ],
            tooltip: {
                trigger: 'item',
                axisPointer: {
                    type: 'shadow'
                }
                },
                grid: {
                    left: '10%',
                    right: '10%',
                    bottom: '15%'
                    },
                    xAxis: {
                        type: 'category',
                        data: data.axisData,
                        boundaryGap: true,
                        nameGap: 30,
                        splitArea: {
                            show: false
                            },
                            axisLabel: {
                                formatter: '示例 {value}'
                                },
                                splitLine: {
                                    show: false
                                }
                                },
                                yAxis: {
                                    type: 'value',
                                    name: '单位/单位 ',
                                    splitArea: {
                                        show: true
                                    }
                                    },
                                    series: [
                                    {
                                        name: 'boxplot',
                                        type: 'boxplot',
                                        data: data.boxData,
                                        tooltip: {
                                            formatter: function (param) {
                                                return [
                                                'Experiment ' + param.name + ': ',
                                                'upper: ' + param.data[4],
                                                'Q3: ' + param.data[3],
                                                'median: ' + param.data[2],
                                                'Q1: ' + param.data[1],
                                                'lower: ' + param.data[0]
                                                ].join('<br/>')
                                            }
                                        }
                                        },
                                        {
                                            name: 'outlier',
                                            type: 'scatter',
                                            data: data.outliers
                                        }
                                        ]
             };
其中series中type: 'boxplot'和type: 'scatter'表示该图表类型是箱线图和散点图的组合。
其他属性配置请参考官网配置项手册:http://echarts.baidu.com/option.html。
四:加载配置 最后通过setOption方法加载配置并显示:
boxplotchart.setOption(option);
# GaugeChart:仪表盘
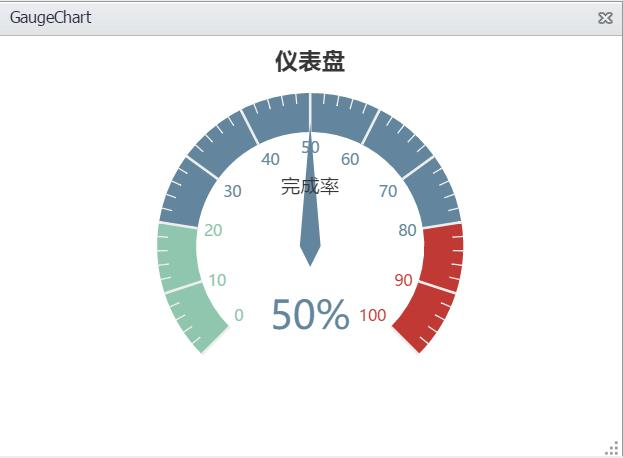
一:初始化 设置图表显示区域大小:
<div id="chartContainer" style=" height:400px;"></div>
调用Echarts内置方法init进行初始化:
var gaugechart =echarts.init(document.getElementById(chartContainer));
二:配置属性 在option中配置属性:
 var option = {
    title : {
        text: "仪表盘",
        left:"center"
        },
        tooltip : {
            formatter: "{a} <br/>{b} : {c}%"
            },
            series: [
            {
                name: '指标示例',
                type: 'gauge',
                detail: {formatter:'{value}%'},
                data: [{value: 50, name: '完成率'}]
            }
            ]
  };
其中series中type: 'gauge'表示该图表类型是仪表盘。
其他属性配置请参考官网配置项手册:http://echarts.baidu.com/option.html。
三:加载配置 最后通过setOption方法加载配置并显示:
gaugechart.setOption(option);
# FunnelChart:漏斗图
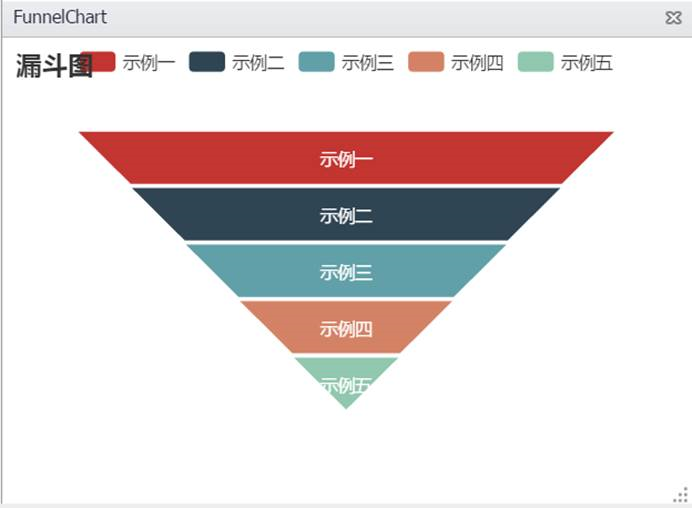
一:初始化 设置图表显示区域大小:
<div id="chartContainer" style=" height:400px;"></div>
调用Echarts内置方法init进行初始化:
var funnelchart =echarts.init(document.getElementById(chartContainer));
二:配置属性 在option中配置属性:
 option = {
    title: {
        text: '漏斗图'
        },
        tooltip: {
            trigger: 'item',
            formatter: "{a} <br/>{b} : {c}%"
            },
            legend: {
                data: ['示例一','示例二','示例三','示例四','示例五']
                },
                calculable: true,
                series: [
                {
                    name:'漏斗图',
                    type:'funnel',
                    left: '10%',
                    top: 60,
                    //x2: 80,
                    bottom: 60,
                    width: '80%',
                    // height: {totalHeight} - y - y2,
                    min: 0,
                    max: 100,
                    minSize: '0%',
                    maxSize: '100%',
                    sort: 'descending',
                    gap: 2,
                    label: {
                        normal: {
                            show: true,
                            position: 'inside'
                            },
                            emphasis: {
                                textStyle: {
                                    fontSize: 20
                                }
                            }
                            },
                            labelLine: {
                                normal: {
                                    length: 10,
                                    lineStyle: {
                                        width: 1,
                                        type: 'solid'
                                    }
                                }
                                },
                                itemStyle: {
                                    normal: {
                                        borderColor: '#fff',
                                        borderWidth: 1
                                    }
                                    },
                                    data: [
                                    {value: 100, name: '示例一'},
                                    {value: 80, name: '示例二'},
                                    {value: 60, name: '示例三'},
                                    {value: 40, name: '示例四'},
                                {value: 20, name: '示例五'}
                                ]
                            }
                          ]
                };
其中series中type:'funnel'表示该图表类型是漏斗图。
其他属性配置请参考官网配置项手册:http://echarts.baidu.com/option.html。
三:加载配置 最后通过setOption方法加载配置并显示:
funnelchart.setOption(option);
# HeatMapChart:热点图
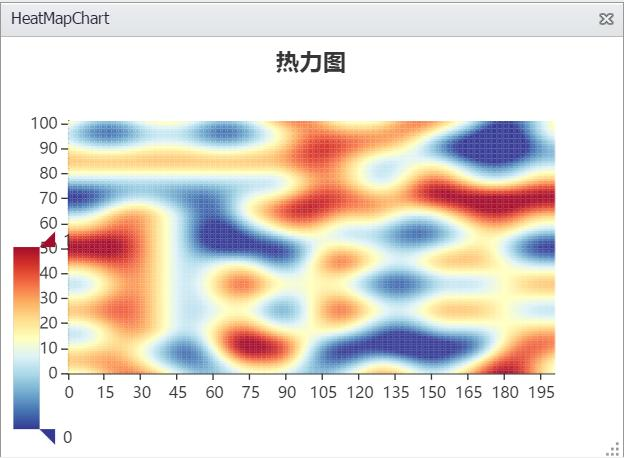
一:初始化 设置图表显示区域大小:
<div id="chartContainer" style=" height:400px;"></div>
调用Echarts内置方法init进行初始化:
var heatmapchart =echarts.init(document.getElementById(chartContainer));
二:数据处理 加载数据,保存在xData和yData数组中。
如,以下通过随机函数生成数据:
var noise = getNoiseHelper();
var xData = [];
var yData = [];
noise.seed(Math.random());
function generateData(theta, min, max) {
    var data = [];
    for (var i = 0; i <= 200; i++) {
        for (var j = 0; j <= 100; j++) {
            // var x = (max - min) * i / 200 + min;
            // var y = (max - min) * j / 100 + min;
            data.push([i, j, noise.perlin2(i / 40, j / 20) + 0.5]);
            // data.push([i, j, normalDist(theta, x) * normalDist(theta, y)]);
        }
        yData.push(i);
        xData.push(i);
    }
    return data;
}
var data = generateData(2, -5, 5);
三:配置属性
在option中配置属性:
option = {
title: {
text: '热力图',
left: 'center'
},
tooltip: {},
xAxis: {
type: 'category',
data: xData
},
yAxis: {
type: 'category',
data: yData
},
visualMap: {
min: 0,
max: 1,
calculable: true,
realtime: false,
inRange: {
color: ['#313695', '#4575b4', '#74add1', '#abd9e9', '#e0f3f8', '#ffffbf', '#fee090', '#fdae61', '#f46d43', '#d73027', '#a50026']
}
},
series: [{
name: '热度值',
type: 'heatmap',
data: data,
itemStyle: {
emphasis: {
borderColor: '#333',
borderWidth: 1
}
},
progressive: 1000,
animation: false
}]
};
///////////////////////////////////////////////////////////////////////////
// Simplex and perlin noise helper from https://github.com/josephg/noisejs
///////////////////////////////////////////////////////////////////////////
function getNoiseHelper(global) {
var module = {};
function Grad(x, y, z) {
this.x = x; this.y = y; this.z = z;
}
Grad.prototype.dot2 = function(x, y) {
return this.x*x + this.y*y;
};
Grad.prototype.dot3 = function(x, y, z) {
return this.x*x + this.y*y + this.z*z;
};
var grad3 = [new Grad(1,1,0),new Grad(-1,1,0),new Grad(1,-1,0),new Grad(-1,-1,0),
new Grad(1,0,1),new Grad(-1,0,1),new Grad(1,0,-1),new Grad(-1,0,-1),
new Grad(0,1,1),new Grad(0,-1,1),new Grad(0,1,-1),new Grad(0,-1,-1)];
var p = [151,160,137,91,90,15,
131,13,201,95,96,53,194,233,7,225,140,36,103,30,69,142,8,99,37,240,21,10,23,
190, 6,148,247,120,234,75,0,26,197,62,94,252,219,203,117,35,11,32,57,177,33,
88,237,149,56,87,174,20,125,136,171,168, 68,175,74,165,71,134,139,48,27,166,
77,146,158,231,83,111,229,122,60,211,133,230,220,105,92,41,55,46,245,40,244,
102,143,54, 65,25,63,161, 1,216,80,73,209,76,132,187,208, 89,18,169,200,196,
135,130,116,188,159,86,164,100,109,198,173,186, 3,64,52,217,226,250,124,123,
5,202,38,147,118,126,255,82,85,212,207,206,59,227,47,16,58,17,182,189,28,42,
223,183,170,213,119,248,152, 2,44,154,163, 70,221,153,101,155,167, 43,172,9,
129,22,39,253, 19,98,108,110,79,113,224,232,178,185, 112,104,218,246,97,228,
251,34,242,193,238,210,144,12,191,179,162,241, 81,51,145,235,249,14,239,107,
49,192,214, 31,181,199,106,157,184, 84,204,176,115,121,50,45,127, 4,150,254,
138,236,205,93,222,114,67,29,24,72,243,141,128,195,78,66,215,61,156,180];
// To remove the need for index wrapping, double the permutation table length
var perm = new Array(512);
var gradP = new Array(512);
// This isn't a very good seeding function, but it works ok. It supports 2^16
// different seed values. Write something better if you need more seeds.
module.seed = function(seed) {
if(seed > 0 && seed < 1) {
// Scale the seed out
seed *= 65536;
}
seed = Math.floor(seed);
if(seed < 256) {
seed |= seed << 8;
}
for(var i = 0; i < 256; i++) {
var v;
if (i & 1) {
v = p[i] ^ (seed & 255);
} else {
v = p[i] ^ ((seed>>8) & 255);
}
perm[i] = perm[i + 256] = v;
gradP[i] = gradP[i + 256] = grad3[v % 12];
}
};
module.seed(0);
/*
for(var i=0; i<256; i++) {
perm[i] = perm[i + 256] = p[i];
gradP[i] = gradP[i + 256] = grad3[perm[i] % 12];
}*/
// Skewing and unskewing factors for 2, 3, and 4 dimensions
var F2 = 0.5*(Math.sqrt(3)-1);
var G2 = (3-Math.sqrt(3))/6;
var F3 = 1/3;
var G3 = 1/6;
// 2D simplex noise
module.simplex2 = function(xin, yin) {
var n0, n1, n2; // Noise contributions from the three corners
// Skew the input space to determine which simplex cell we're in
var s = (xin+yin)*F2; // Hairy factor for 2D
var i = Math.floor(xin+s);
var j = Math.floor(yin+s);
var t = (i+j)*G2;
var x0 = xin-i+t; // The x,y distances from the cell origin, unskewed.
var y0 = yin-j+t;
// For the 2D case, the simplex shape is an equilateral triangle.
// Determine which simplex we are in.
var i1, j1; // Offsets for second (middle) corner of simplex in (i,j) coords
if(x0>y0) { // lower triangle, XY order: (0,0)->(1,0)->(1,1)
i1=1; j1=0;
} else { // upper triangle, YX order: (0,0)->(0,1)->(1,1)
i1=0; j1=1;
}
// A step of (1,0) in (i,j) means a step of (1-c,-c) in (x,y), and
// a step of (0,1) in (i,j) means a step of (-c,1-c) in (x,y), where
// c = (3-sqrt(3))/6
var x1 = x0 - i1 + G2; // Offsets for middle corner in (x,y) unskewed coords
var y1 = y0 - j1 + G2;
var x2 = x0 - 1 + 2 * G2; // Offsets for last corner in (x,y) unskewed coords
var y2 = y0 - 1 + 2 * G2;
// Work out the hashed gradient indices of the three simplex corners
i &= 255;
j &= 255;
var gi0 = gradP[i+perm[j]];
var gi1 = gradP[i+i1+perm[j+j1]];
var gi2 = gradP[i+1+perm[j+1]];
// Calculate the contribution from the three corners
var t0 = 0.5 - x0*x0-y0*y0;
if(t0<0) {
n0 = 0;
} else {
t0 *= t0;
n0 = t0 * t0 * gi0.dot2(x0, y0); // (x,y) of grad3 used for 2D gradient
}
var t1 = 0.5 - x1*x1-y1*y1;
if(t1<0) {
n1 = 0;
} else {
t1 *= t1;
n1 = t1 * t1 * gi1.dot2(x1, y1);
}
var t2 = 0.5 - x2*x2-y2*y2;
if(t2<0) {
n2 = 0;
} else {
t2 *= t2;
n2 = t2 * t2 * gi2.dot2(x2, y2);
}
// Add contributions from each corner to get the final noise value.
// The result is scaled to return values in the interval [-1,1].
return 70 * (n0 + n1 + n2);
};
// 3D simplex noise
module.simplex3 = function(xin, yin, zin) {
var n0, n1, n2, n3; // Noise contributions from the four corners
// Skew the input space to determine which simplex cell we're in
var s = (xin+yin+zin)*F3; // Hairy factor for 2D
var i = Math.floor(xin+s);
var j = Math.floor(yin+s);
var k = Math.floor(zin+s);
var t = (i+j+k)*G3;
var x0 = xin-i+t; // The x,y distances from the cell origin, unskewed.
var y0 = yin-j+t;
var z0 = zin-k+t;
// For the 3D case, the simplex shape is a slightly irregular tetrahedron.
// Determine which simplex we are in.
var i1, j1, k1; // Offsets for second corner of simplex in (i,j,k) coords
var i2, j2, k2; // Offsets for third corner of simplex in (i,j,k) coords
if(x0 >= y0) {
if(y0 >= z0) { i1=1; j1=0; k1=0; i2=1; j2=1; k2=0; }
else if(x0 >= z0) { i1=1; j1=0; k1=0; i2=1; j2=0; k2=1; }
else { i1=0; j1=0; k1=1; i2=1; j2=0; k2=1; }
} else {
if(y0 < z0) { i1=0; j1=0; k1=1; i2=0; j2=1; k2=1; }
else if(x0 < z0) { i1=0; j1=1; k1=0; i2=0; j2=1; k2=1; }
else { i1=0; j1=1; k1=0; i2=1; j2=1; k2=0; }
}
// A step of (1,0,0) in (i,j,k) means a step of (1-c,-c,-c) in (x,y,z),
// a step of (0,1,0) in (i,j,k) means a step of (-c,1-c,-c) in (x,y,z), and
// a step of (0,0,1) in (i,j,k) means a step of (-c,-c,1-c) in (x,y,z), where
// c = 1/6.
var x1 = x0 - i1 + G3; // Offsets for second corner
var y1 = y0 - j1 + G3;
var z1 = z0 - k1 + G3;
var x2 = x0 - i2 + 2 * G3; // Offsets for third corner
var y2 = y0 - j2 + 2 * G3;
var z2 = z0 - k2 + 2 * G3;
var x3 = x0 - 1 + 3 * G3; // Offsets for fourth corner
var y3 = y0 - 1 + 3 * G3;
var z3 = z0 - 1 + 3 * G3;
// Work out the hashed gradient indices of the four simplex corners
i &= 255;
j &= 255;
k &= 255;
var gi0 = gradP[i+ perm[j+ perm[k ]]];
var gi1 = gradP[i+i1+perm[j+j1+perm[k+k1]]];
var gi2 = gradP[i+i2+perm[j+j2+perm[k+k2]]];
var gi3 = gradP[i+ 1+perm[j+ 1+perm[k+ 1]]];
// Calculate the contribution from the four corners
var t0 = 0.6 - x0*x0 - y0*y0 - z0*z0;
if(t0<0) {
n0 = 0;
} else {
t0 *= t0;
n0 = t0 * t0 * gi0.dot3(x0, y0, z0); // (x,y) of grad3 used for 2D gradient
}
var t1 = 0.6 - x1*x1 - y1*y1 - z1*z1;
if(t1<0) {
n1 = 0;
} else {
t1 *= t1;
n1 = t1 * t1 * gi1.dot3(x1, y1, z1);
}
var t2 = 0.6 - x2*x2 - y2*y2 - z2*z2;
if(t2<0) {
n2 = 0;
} else {
t2 *= t2;
n2 = t2 * t2 * gi2.dot3(x2, y2, z2);
}
var t3 = 0.6 - x3*x3 - y3*y3 - z3*z3;
if(t3<0) {
n3 = 0;
} else {
t3 *= t3;
n3 = t3 * t3 * gi3.dot3(x3, y3, z3);
}
// Add contributions from each corner to get the final noise value.
// The result is scaled to return values in the interval [-1,1].
return 32 * (n0 + n1 + n2 + n3);
};
//
function fade(t) {
return t*t*t*(t*(t*6-15)+10);
}
function lerp(a, b, t) {
return (1-t)*a + t*b;
}
// 2D Perlin Noise
module.perlin2 = function(x, y) {
// Find unit grid cell containing point
var X = Math.floor(x), Y = Math.floor(y);
// Get relative xy coordinates of point within that cell
x = x - X; y = y - Y;
// Wrap the integer cells at 255 (smaller integer period can be introduced here)
X = X & 255; Y = Y & 255;
// Calculate noise contributions from each of the four corners
var n00 = gradP[X+perm[Y]].dot2(x, y);
var n01 = gradP[X+perm[Y+1]].dot2(x, y-1);
var n10 = gradP[X+1+perm[Y]].dot2(x-1, y);
var n11 = gradP[X+1+perm[Y+1]].dot2(x-1, y-1);
// Compute the fade curve value for x
var u = fade(x);
// Interpolate the four results
return lerp(
lerp(n00, n10, u),
lerp(n01, n11, u),
fade(y));
};
// 3D Perlin Noise
module.perlin3 = function(x, y, z) {
// Find unit grid cell containing point
var X = Math.floor(x), Y = Math.floor(y), Z = Math.floor(z);
// Get relative xyz coordinates of point within that cell
x = x - X; y = y - Y; z = z - Z;
// Wrap the integer cells at 255 (smaller integer period can be introduced here)
X = X & 255; Y = Y & 255; Z = Z & 255;
// Calculate noise contributions from each of the eight corners
var n000 = gradP[X+ perm[Y+ perm[Z ]]].dot3(x, y, z);
var n001 = gradP[X+ perm[Y+ perm[Z+1]]].dot3(x, y, z-1);
var n010 = gradP[X+ perm[Y+1+perm[Z ]]].dot3(x, y-1, z);
var n011 = gradP[X+ perm[Y+1+perm[Z+1]]].dot3(x, y-1, z-1);
var n100 = gradP[X+1+perm[Y+ perm[Z ]]].dot3(x-1, y, z);
var n101 = gradP[X+1+perm[Y+ perm[Z+1]]].dot3(x-1, y, z-1);
var n110 = gradP[X+1+perm[Y+1+perm[Z ]]].dot3(x-1, y-1, z);
var n111 = gradP[X+1+perm[Y+1+perm[Z+1]]].dot3(x-1, y-1, z-1);
// Compute the fade curve value for x, y, z
var u = fade(x);
var v = fade(y);
var w = fade(z);
// Interpolate
return lerp(
lerp(
lerp(n000, n100, u),
lerp(n001, n101, u), w),
lerp(
lerp(n010, n110, u),
lerp(n011, n111, u), w),
v);
};
return module;
}
其中getNoiseHelper()函数是调用Simplex and perlin noise helper。 网址:https://github.com/josephg/noisejs
series中type:'heatmap'表示该图表类型为热点图。
其他属性配置请参考官网配置项手册:http://echarts.baidu.com/option.html。
四:加载配置 最后通过setOption方法加载配置并显示:
heatmapchart.setOption(option);
# ParallelChart:平行坐标图
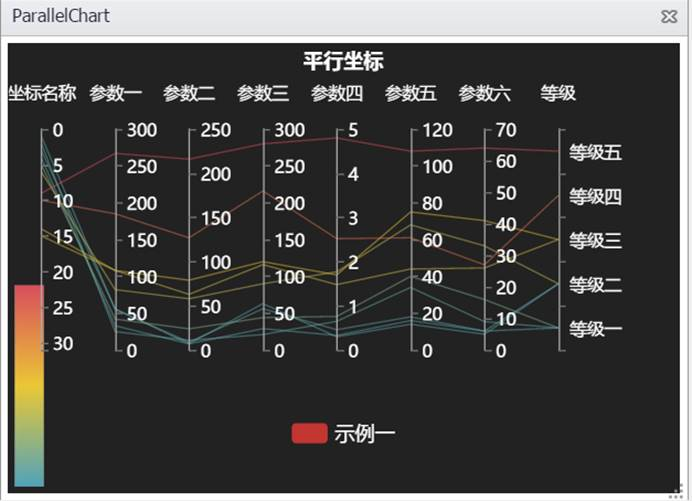
一:初始化 设置图表显示区域大小:
<div id="chartContainer" style=" height:400px;"></div>
调用Echarts内置方法init进行初始化:
var parallelchart =echarts.init(document.getElementById(chartContainer));
二:数据处理 定义数据,其中每一组数据表示一条折线,多组数据组成平行坐标图:
var data1 = [
[1,55,9,56,0.46,18,6,"等级二"],
[2,25,11,21,0.65,34,9,"等级一"],
[3,56,7,63,0.3,14,5,"等级二"],
[4,33,7,29,0.33,16,6,"等级一"],
[5,42,24,44,0.76,40,16,"等级一"],
[6,82,58,90,1.77,68,33,"等级二"],
[9,267,216,280,4.8,108,64,"等级五"],
[10,185,127,216,2.52,61,27,"等级四"],
[14,108,79,120,1.7,75,41,"等级三"],
[15,108,63,116,1.48,44,26,"等级三"]
];
定义schema,其中每组数据表示schema的名称、下标位置以及显示名称:
 var schema = [
{name: '坐标名称', index: 0, text: '坐标名称'},
{name: '参数一', index: 1, text: '参数一'},
{name: '参数二', index: 2, text: '参数二'},
{name: '参数三', index: 3, text: '参数三'},
{name: '参数四', index: 4, text: '参数四'},
{name: '参数五', index: 5, text: '参数五'},
{name: '参数六', index: 6, text: '参数六'},
{name: '等级', index: 7, text: '等级'}
];
设置线条的Style:
 var lineStyle = {
normal: {
    width: 1,
    opacity: 0.5
}
};
其中:width表示线条的粗度;opacity表示线条的透明度,范围是0-1。
三:配置属性 在option中配置属性:
 option = {
    backgroundColor: '#222',
    title: {
        text: "平行坐标",
        left: "center",
        textStyle: {
            color: '#fff',
            fontSize: 14
        }
        },
        legend: {
            bottom: 30,
            data: ['示例一'],
            itemGap: 20,
            textStyle: {
                color: '#fff',
                fontSize: 14
            }
            },
            tooltip: {
                padding: 10,
                backgroundColor: '#222',
                borderColor: '#777',
                borderWidth: 1,
                formatter: function (obj) {
                    var value = obj[0].value;
                    return '<div style="border-bottom: 1px solid rgba(255,255,255,.3); font-size: 18px;padding-bottom: 7px;margin-bottom: 7px">'
                    + obj[0].seriesName + ' ' + value[0] + '坐标名称:'
                    + value[7]
                    + '</div>'
                    + schema[1].text + ':' + value[1] + '<br>'
                    + schema[2].text + ':' + value[2] + '<br>'
                    + schema[3].text + ':' + value[3] + '<br>'
                    + schema[4].text + ':' + value[4] + '<br>'
                    + schema[5].text + ':' + value[5] + '<br>'
                    + schema[6].text + ':' + value[6] + '<br>';
                }
                },
                parallelAxis: [
                {dim: 0, name: schema[0].text, inverse: true, max: 31, nameLocation: 'start'},
                {dim: 1, name: schema[1].text},
                {dim: 2, name: schema[2].text},
                {dim: 3, name: schema[3].text},
                {dim: 4, name: schema[4].text},
                {dim: 5, name: schema[5].text},
                {dim: 6, name: schema[6].text},
                {dim: 7, name: schema[7].text,
            type: 'category', data: ['等级一', '等级二', '等级三', '等级四', '等级五']}
            ],
            visualMap: {
                show: true,
                min: 0,
                max: 150,
                dimension: 2,
                inRange: {
                    color: ['#d94e5d','#eac736','#50a3ba'].reverse(),
                }
                },
                parallel: {
                    left: '5%',
                    right: '18%',
                    bottom: 100,
                    parallelAxisDefault: {
                        type: 'value',
                        name: '参数一指数',
                        nameLocation: 'end',
                        nameGap: 20,
                        nameTextStyle: {
                            color: '#fff',
                            fontSize: 12
                            },
                            axisLine: {
                                lineStyle: {
                                    color: '#aaa'
                                }
                                },
                                axisTick: {
                                    lineStyle: {
                                        color: '#777'
                                    }
                                    },
                                    splitLine: {
                                        show: false
                                        },
                                        axisLabel: {
                                            textStyle: {
                                                color: '#fff'
                                            }
                                        }
                                    }
                                    },
                                    series: [
                                    {
                                        name: '示例一',
                                        type: 'parallel',
                                        lineStyle: lineStyle,
                                        data: data1
                                    }
                                    ]
                                    };
其中series中type: 'parallel'表示该图表类型是平行坐标图。
其他属性配置请参考官网配置项手册:http://echarts.baidu.com/option.html。
四:加载配置 最后通过setOption方法加载配置并显示:
parallelchart.setOption(option);
# TreeMapChart:矩形树图

一:初始化 设置图表显示区域大小:
<div id="chartContainer" style=" height:400px;"></div>
调用Echarts内置方法init进行初始化:
var treemapchart = echarts.init(document.getElementById(chartContainer));
二:数据处理 本示例中所用到的rectangletreedata.json的数据结构如下,可以在此基础上自行修改扩充:
 [
    {
        "value": 100,
        "name": "A",
        "path": "A",
        "children": [
            {
                "value": 20,
                "name": "A1",
                "path": "A/A1"
            },
            {
                "value": 40,
                "name": "A2",
                "path": "A/A2"
            }
        ]
    },

    {
        "value": 60,
        "name": "B",
        "path": "B",
        "children": [
            {
                "value": 20,
                "name": "B1",
                "path": "B/B1"
            },
            {
                "value": 30,
                "name": "B2",
                "path": "B/B2"
            },
            {
                "value": 10,
                "name": "B3",
                "path": "B/B3"
            }
        ]
    },
     {
        "value": 60,
        "name": "C",
        "path": "C",
        "children": [
            {
                "value": 20,
                "name": "C1",
                "path": "C/C1"
            },
            {
                "value": 15,
                "name": "C2",
                "path": "C/C2"
            },
            {
                "value": 15,
                "name": "C3",
                "path": "C/C3"
            },
            {
                "value": 10,
                "name": "C4",
                "path": "C/C4"
            }
        ]
    }

]
三:配置并加载配置
$.get('rectangletreedata.json', function (diskData) {
    treemapchart.hideLoading();

    function colorMappingChange(value) {
        var levelOption = getLevelOption(value);
        chart.setOption({
            series: [{
                levels: levelOption
                }]
                });
            }

            var formatUtil = echarts.format;

            function getLevelOption() {
                return [
                {
                    itemStyle: {
                        normal: {
                            borderWidth: 0,
                            gapWidth: 5
                        }
                    }
                    },
                    {
                        itemStyle: {
                            normal: {
                                gapWidth: 1
                            }
                        }
                        },
                        {
                            colorSaturation: [0.35, 0.5],
                            itemStyle: {
                                normal: {
                                    gapWidth: 1,
                                    borderColorSaturation: 0.6
                                }
                            }
                        }
                        ];
                    }

                    treemapchart.setOption(option = {

                        title: {
                            text: '矩形树图',
                            left: 'center'
                            },

                            tooltip: {
                                formatter: function (info) {
                                    var value = info.value;
                                    var treePathInfo = info.treePathInfo;
                                    var treePath = [];

                                    for (var i = 1; i < treePathInfo.length; i++) {
                                        treePath.push(treePathInfo[i].name);
                                    }

                                    return [
                                    '<div class="tooltip-title">' + formatUtil.encodeHTML(treePath.join('/')) + '</div>',
                                    '示例一: ' + formatUtil.addCommas(value) + ' 单位',
                                    ].join('');
                                }
                                },

                                series: [
                                {
                                    name:'示例一',
                                    type:'treemap',
                                    visibleMin: 300,
                                    label: {
                                        show: true,
                                        formatter: '{b}'
                                        },
                                        itemStyle: {
                                            normal: {
                                                borderColor: '#fff'
                                            }
                                            },
                                            levels: getLevelOption(),
                                            data: diskData
                                        }
                                        ]
                                        });
       });
其中$.get('rectangletreedata.json', function (diskData) {…}表示读取json文件中的数据并赋值给diskData。
option中type:'treemap'表示该图表类型为矩形树图。
其他属性配置请参考官网配置项手册:http://echarts.baidu.com/option.html。
# GraphChart:关系图
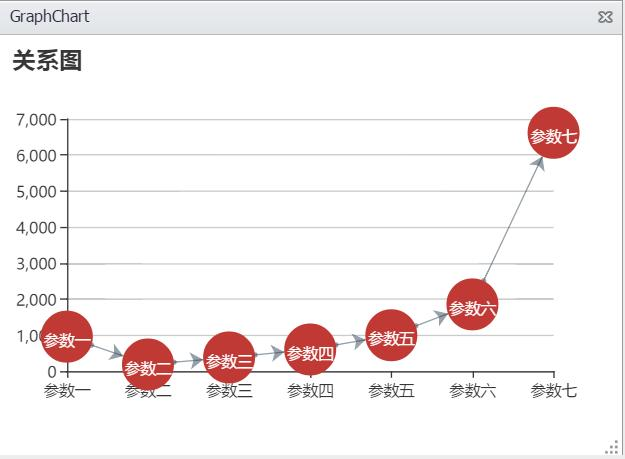
一:初始化 设置图表显示区域大小:
<div id="chartContainer" style=" height:400px;"></div>
调用Echarts内置方法init进行初始化:
var graphchart =echarts.init(document.getElementById(chartContainer));
二:数据处理 定义坐标轴数据组:
var axisData = ['参数一','参数二','参数三','参数四','参数五','参数六','参数七'];
定义与坐标轴对应的数据,本示例采取随机函数生成数据:
 var data = axisData.map(function (item, i) {
    return Math.round(Math.random() * 1000 * (i + 1));
    });
定义源数据和目标数据之间的关系:
 var links = data.map(function (item, i) {
    return {
        source: i,
        target: i + 1
        };
        });
三:配置属性
在option中配置属性:
 option = {
    title: {
        text: '关系图'
        },
        tooltip: {},
        xAxis: {
            type : 'category',
            boundaryGap : false,
            data : axisData
            },
            yAxis: {
                type : 'value'
                },
                series: [
                {
                    type: 'graph',
                    layout: 'none',
                    coordinateSystem: 'cartesian2d',
                    symbolSize: 40,
                    label: {
                        normal: {
                            show: true
                        }
                        },
                        edgeSymbol: ['circle', 'arrow'],
                        edgeSymbolSize: [4, 10],
                        data: data,
                        links: links,
                        lineStyle: {
                            normal: {
                                color: '#2f4554'
                            }
                        }
                    }
                    ]
                    };
其中series中type: 'graph'表示该图表类型是关系图。
其他属性配置请参考官网配置项手册:http://echarts.baidu.com/option.html。
四:加载配置 最后通过setOption方法加载配置并显示:
graphchart.setOption(option);
# SankeyChart:桑基图
一:初始化 设置图表显示区域大小:
<div id="chartContainer" style=" height:400px;"></div>
调用Echarts内置方法init进行初始化:
var sankeychart = echarts.init(document.getElementById(chartContainer));
二:数据处理 本示例中所用到的sankeydata.json的数据结构如下,可以在此基础上自行修改扩充:
 {"nodes": [
      {"name": "A"},

      {"name": "B1"},
      {"name": "B2"},

      {"name": "C1"},
      {"name": "C2"},
      {"name": "C3"},
      {"name": "C4"},
      {"name": "C5"},

      {"name": "D1"},
      {"name": "D2"},
      {"name": "D3"},
      {"name": "D4"},
      {"name": "D5"}
   ],
   "links": [
      {"source": "A", "target": "B1", "value": 50},
      {"source": "A", "target": "B2", "value": 50},

      {"source": "B1", "target": "C1", "value": 38},
      {"source": "B1", "target": "C2", "value": 12},
      {"source": "B2", "target": "C3", "value": 22},
      {"source": "B2", "target": "C4", "value": 15},
      {"source": "B2", "target": "C5", "value": 13},

      {"source": "C1", "target": "D1", "value": 15},
      {"source": "C1", "target": "D3", "value": 13},
      {"source": "C1", "target": "D5", "value": 10},
      {"source": "C2", "target": "D1", "value": 12},
      {"source": "C3", "target": "D2", "value": 12},
      {"source": "C3", "target": "D5", "value": 10},
      {"source": "C4", "target": "D1", "value": 5},
      {"source": "C4", "target": "D2", "value": 4},
      {"source": "C4", "target": "D3", "value": 3},
      {"source": "C4", "target": "D4", "value": 2},
      {"source": "C4", "target": "D5", "value": 1},
      {"source": "C5", "target": "D5", "value": 13}
   ]}
三:配置并加载配置
$.get('<%= request.getContextPath() %>/common/nui/echart/json/sankeydata.json', function (data) {
    sankeychart.hideLoading();

    sankeychart.setOption(option = {
        title: {
            text: '桑基图',
            left: 'center',
            },
            tooltip: {
                trigger: 'item',
                triggerOn: 'mousemove'

                },
                series: [
                {
                    type: 'sankey',
                    layout:'none',
                    data: data.nodes,
                    links: data.links,
                    itemStyle: {
                        normal: {
                            borderWidth: 1,
                            borderColor: '#aaa'
                        }
                        },
                        lineStyle: {
                            normal: {
                                curveness: 0.5
                            }
                        }
                    }
                    ]
                    });
          });
其中$.get('sankeydata.json', function (diskData) {…}表示读取json文件中的数据并赋值给diskData。
option中type:' sankey'表示该图表类型为桑基图。
其他属性配置请参考官网配置项手册:http://echarts.baidu.com/option.html。